OPEN-SOURCE SCRIPT
Zaktualizowano Isolated Peak and Bottom (Tuncer ŞENGÖZ) by KıvanÇ fr3762
This Technique is created by Tuncer Şengöz @TuncerSengoz on twitter
An uptrend with higher highs might not make new highs everyday. So how could we define the end of an uptrend? How could we tell the difference between the end of an uptrend and a temporary correction? This isolated high/low technique aims to help us in this kind of situations.
We call the highest point of an uptrend until the particular day “an isolated Peak” and consider the lowest point of the day before as a signal level. If the signal level is broken in 2 days, we assume the uptrend to be over. If it is not broken in 2 days, the uptrend continues. The same technique also applies to a downtrend and the only difference would be the direction.
conversely it has the same logic of finding an end of a downtrend, called "Isolated Bottom" which can be considered the highest point of the day before as a signal level the same way.
The success rate of this technique is quite high (around 85%). There is no required term for this technique and it can be used in yearly, daily or ticker charts, because the market moves in fractals and repeats itself in every scale.
As in every technique, it might also give false signals in some situations like extreme volatility or emotional decisions of masses. However, it will be very helpful for us to indicate the direction of a trend.
Creator: Tuncer ŞENGÖZ @TuncerSengoz on twitter
Informacje o Wersji
formula updatedInformacje o Wersji
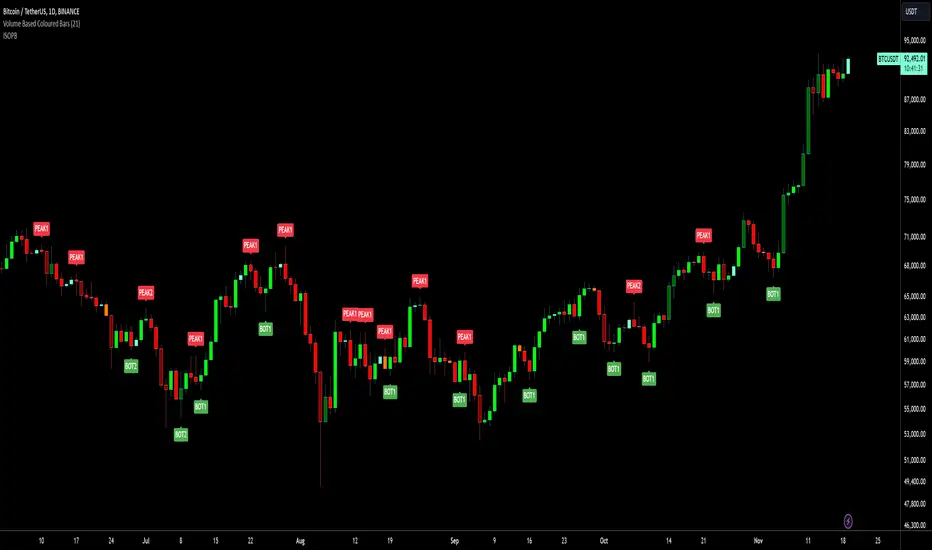
PEAK1: Isolated Peak conditions occured 1 bar after the peakPEAK2: Isolated Peak conditions occured 2 bars after the peak
BOT1: Isolated Bottom conditions occured 1 bar after the bottom
BOT2: Isolated Bottom conditions occured 2 bars after the bottom
Informacje o Wersji
addded alarms and code updated to V6Skrypt open-source
W zgodzie z duchem TradingView twórca tego skryptu udostępnił go jako open-source, aby użytkownicy mogli przejrzeć i zweryfikować jego działanie. Ukłony dla autora. Korzystanie jest bezpłatne, jednak ponowna publikacja kodu podlega naszym Zasadom serwisu.
Telegram t.me/AlgoRhytm
YouTube (Turkish): youtube.com/c/kivancozbilgic
YouTube (English): youtube.com/c/AlgoWorld
YouTube (Turkish): youtube.com/c/kivancozbilgic
YouTube (English): youtube.com/c/AlgoWorld
Wyłączenie odpowiedzialności
Informacje i publikacje nie stanowią i nie powinny być traktowane jako porady finansowe, inwestycyjne, tradingowe ani jakiekolwiek inne rekomendacje dostarczane lub zatwierdzone przez TradingView. Więcej informacji znajduje się w Warunkach użytkowania.
Skrypt open-source
W zgodzie z duchem TradingView twórca tego skryptu udostępnił go jako open-source, aby użytkownicy mogli przejrzeć i zweryfikować jego działanie. Ukłony dla autora. Korzystanie jest bezpłatne, jednak ponowna publikacja kodu podlega naszym Zasadom serwisu.
Telegram t.me/AlgoRhytm
YouTube (Turkish): youtube.com/c/kivancozbilgic
YouTube (English): youtube.com/c/AlgoWorld
YouTube (Turkish): youtube.com/c/kivancozbilgic
YouTube (English): youtube.com/c/AlgoWorld
Wyłączenie odpowiedzialności
Informacje i publikacje nie stanowią i nie powinny być traktowane jako porady finansowe, inwestycyjne, tradingowe ani jakiekolwiek inne rekomendacje dostarczane lub zatwierdzone przez TradingView. Więcej informacji znajduje się w Warunkach użytkowania.