█ OVERVIEW
This Pine script shows how it can be quite simple to personalize a built-in indicator for your needs.
█ OUR SCRIPT
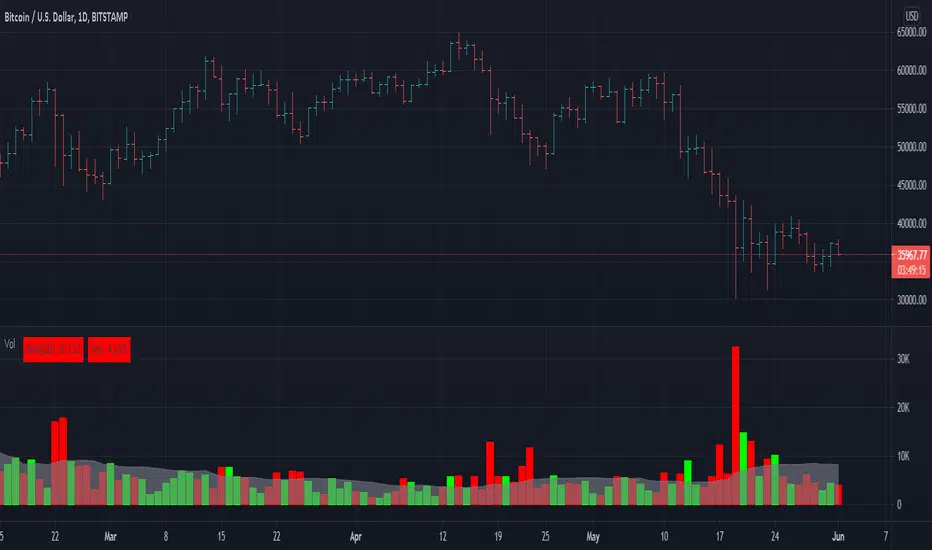
Our objective was to add the current values for volume and its moving average in prominent view, and use brighter colors than the built-in.
We started with the source code from the "Volume" built-in indicator. You can access the source code of many built-ins from the Pine Editor by clicking the "Open" button and choosing "New default built-in script..."
We changed the variable names so they conform to our Coding Conventions. Everybody is of course free to code their scripts the way they want; the conventions provide guidelines for those interested in Pine-specific recommendations. We use our conventions to make our code more readable, which helps readers of open-source publications. As Uncle Bob, a.k.a. Robert Cecil Martin, argues in his "Clean Code" book, code that is easier to read is also useful for its first user: you.
We assigned the colors we use to constants because they are used in multiple places in the script. If we decide to change them, we only need to change the constant definitions for the change to trickle down to the rest of the code.
We used the `inline` and `tooltip` parameters of input() to better organize our inputs and provide extra information under an "i" icon when needed.
We wanted to pack more information in the display of the moving average and volume than just the values, so we color-coded their background:
• When the MA is rising, the background of its table cell is in the bull color, otherwise it's in the bear color. The period used for the MA is also displayed in that cell's legend.
• When the current volume's value is higher/lower than its MA, the background of its cell is of bull/bear color.
We use a Pine table to display our values. We use extra cells to provide a configurable margin to the left, and a small space between the two values.
Because we only use constant colors in this script (i.e., values that are known at compile time), users can change the colors in the "Setting/Style" tab's color widgets. Users of the script can also use the tab to change other attributes of the plots.
Look first. Then leap.
This Pine script shows how it can be quite simple to personalize a built-in indicator for your needs.
█ OUR SCRIPT
Our objective was to add the current values for volume and its moving average in prominent view, and use brighter colors than the built-in.
We started with the source code from the "Volume" built-in indicator. You can access the source code of many built-ins from the Pine Editor by clicking the "Open" button and choosing "New default built-in script..."
We changed the variable names so they conform to our Coding Conventions. Everybody is of course free to code their scripts the way they want; the conventions provide guidelines for those interested in Pine-specific recommendations. We use our conventions to make our code more readable, which helps readers of open-source publications. As Uncle Bob, a.k.a. Robert Cecil Martin, argues in his "Clean Code" book, code that is easier to read is also useful for its first user: you.
We assigned the colors we use to constants because they are used in multiple places in the script. If we decide to change them, we only need to change the constant definitions for the change to trickle down to the rest of the code.
We used the `inline` and `tooltip` parameters of input() to better organize our inputs and provide extra information under an "i" icon when needed.
We wanted to pack more information in the display of the moving average and volume than just the values, so we color-coded their background:
• When the MA is rising, the background of its table cell is in the bull color, otherwise it's in the bear color. The period used for the MA is also displayed in that cell's legend.
• When the current volume's value is higher/lower than its MA, the background of its cell is of bull/bear color.
We use a Pine table to display our values. We use extra cells to provide a configurable margin to the left, and a small space between the two values.
Because we only use constant colors in this script (i.e., values that are known at compile time), users can change the colors in the "Setting/Style" tab's color widgets. Users of the script can also use the tab to change other attributes of the plots.
Look first. Then leap.
Informacje o Wersji
v2Added `minval = 1` to MA length input (thx @midtownsk8rguy).
Informacje o Wersji
v3Updated Code
The code has been updated to use Pine Script™ v5. It follows the most recent recommendations from the Pine Script™ User Manual's Style Guide.
Skrypt open-source
W zgodzie z duchem TradingView twórca tego skryptu udostępnił go jako open-source, aby użytkownicy mogli przejrzeć i zweryfikować jego działanie. Ukłony dla autora. Korzystanie jest bezpłatne, jednak ponowna publikacja kodu podlega naszym Zasadom serwisu.
Who are PineCoders? tradingview.com/chart/SSP/yW5eOqtm-Who-are-PineCoders/
Tools and ideas for all Pine coders: pinecoders.com
Tools and ideas for all Pine coders: pinecoders.com
Wyłączenie odpowiedzialności
Informacje i publikacje nie stanowią i nie powinny być traktowane jako porady finansowe, inwestycyjne, tradingowe ani jakiekolwiek inne rekomendacje dostarczane lub zatwierdzone przez TradingView. Więcej informacji znajduje się w Warunkach użytkowania.