Mean Reversion MA [acatwithwithcharts]
In order to get this to work with useful precision, it has to be limited to SMA and regular STDEV. I have not found a way to reduce the Pinescript loop time enough otherwise while maintaining much precision. Even still, it will sometimes time out and need to be refreshed by either switching TF/symbol or reapplying the indicator.
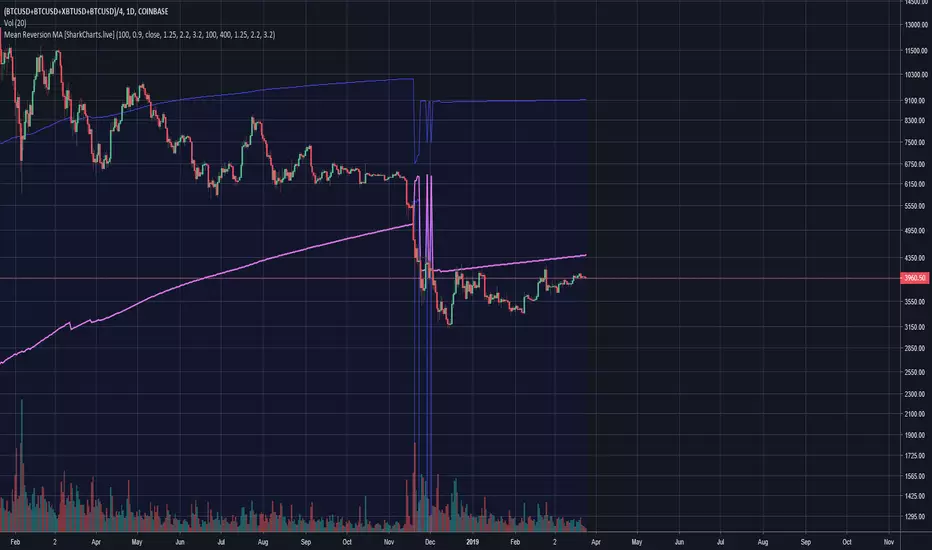
On longer TFs this can result in targets that are extremely distant. No, it’s probably not a useful prediction on the SPX monthly chart that the selloff in 2009 suggests an eventual mean reversion to the 1250 SMA (currently around 358). The last time we had a monthly mean reversion on that chart by this indicator’s telling is 1970. So, use some common sense about how far out is a usefully-tradeable prediction. I’m hoping to find a good way to add functionality to put a cap on extreme long TF predictions without breaking it.
Where it really seems to shine is as a reactive pivot after apparent reversals. Significant trending more or less by definition requires overexpanded volatility on some period length.
I am posting this as invite-only and have a short list of collaborators in mind who will get access if they want it. It is not being made available to the general public as of this posting; I’m vaguely working towards eventually offering being able to offer some sort of paid indicator offering in the future.
Rather than shut the door entirely, I will say that if someone approaches me by PM with a really interesting idea on how they’d like to test this or my other indicators, I’m willing to consider giving access. I’m not giving this away just to anyone who asks and will, for my own time and sanity, probably just ignore requests by people who don't come to me already knowing what this indicator does and how they might want to use it.
I'm excited to announce that we're putting the finishing touches on a subscription service for the volatility theory indicators, and assuming no hiccups will launch them within days. Subscriptions will be available in several packages through SharkCharts.live
Current pricing and subscription details will be kept up-to-date on SharkCharts.live
Skrypt tylko na zaproszenie
Dostęp do tego skryptu mają wyłącznie użytkownicy zatwierdzeni przez autora. Aby z niego korzystać, należy poprosić o zgodę i ją uzyskać. Zgoda jest zazwyczaj udzielana po dokonaniu płatności. Więcej informacji można znaleźć w instrukcjach autora poniżej lub kontaktując się bezpośrednio z acatwithcharts.
TradingView NIE zaleca płacenia za skrypt ani korzystania z niego, jeśli nie ma pełnego zaufania do jego autora i nie rozumie się zasad jego działania. Można również znaleźć darmowe, otwartoźródłowe alternatywy w skryptach społeczności.
Instrukcje autora
Feel free to reach out to me with any questions; more information is available on the SharkCharts website and the SharkCharts discord discord.gg/YVpTeSK
Wyłączenie odpowiedzialności
Skrypt tylko na zaproszenie
Dostęp do tego skryptu mają wyłącznie użytkownicy zatwierdzeni przez autora. Aby z niego korzystać, należy poprosić o zgodę i ją uzyskać. Zgoda jest zazwyczaj udzielana po dokonaniu płatności. Więcej informacji można znaleźć w instrukcjach autora poniżej lub kontaktując się bezpośrednio z acatwithcharts.
TradingView NIE zaleca płacenia za skrypt ani korzystania z niego, jeśli nie ma pełnego zaufania do jego autora i nie rozumie się zasad jego działania. Można również znaleźć darmowe, otwartoźródłowe alternatywy w skryptach społeczności.
Instrukcje autora
Feel free to reach out to me with any questions; more information is available on the SharkCharts website and the SharkCharts discord discord.gg/YVpTeSK