OPEN-SOURCE SCRIPT
Zaktualizowano Bandwidth Bands - Silverman's rule of thumb

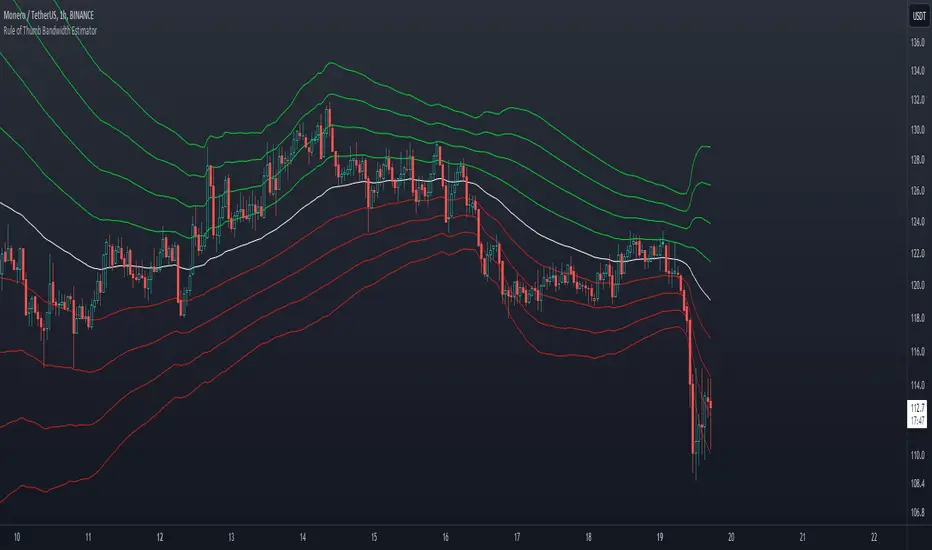
What are Bandwidth Bands?
This indicator uses Silverman Rule of Thumb Bandwidth to estimate the width of bands around the rolling moving average which takes in the log transformation of price to remove most of price skewness for the rest of the volatility calculations and then a exp() function is performed to convert it back to a right skewed distribution. These bandwidths bands could offer insights into price volatility and trading extremes.
Silverman rule of thumb bandwidth:
The Silverman Rule of Thumb Bandwidth is a heuristic method used to estimate the optimal bandwidth for kernel density estimation, a statistical technique for estimating the probability density function of a random variable. In the context of financial analysis, such as in this indicator, it helps determine the width of bands around a moving average, providing insights into the level of volatility in the market. This method is particularly useful because it offers a quick and straightforward way to estimate bandwidth without requiring extensive computational resources or complex mathematical calculation
The bandwidth estimator automatically adjust to the characteristics of the data, providing a flexible and dynamic measure of dispersion that can capture variations in volatility over time. Standard deviations alone may not be as adaptive to changes in data distributions. The Bandwidth considers the overall shape and structure of the data distribution rather than just focusing on the spread of data points.
Settings
- Source
- Sample length
- 1-4 SD options to disable or enable each band
Informacje o Wersji
Fixed variable nameInformacje o Wersji
Fixed a bugInformacje o Wersji
Fixed some variable namingInformacje o Wersji
Correct versionInformacje o Wersji
Fixed a bugInformacje o Wersji
Replaced functions with TradingView default functionsSkrypt open-source
W zgodzie z duchem TradingView twórca tego skryptu udostępnił go jako open-source, aby użytkownicy mogli przejrzeć i zweryfikować jego działanie. Ukłony dla autora. Korzystanie jest bezpłatne, jednak ponowna publikacja kodu podlega naszym Zasadom serwisu.
Link Tree: linktr.ee/tradersendeavors
Access our indicators: patreon.com/user?u=80987417
Access our indicators: patreon.com/user?u=80987417
Wyłączenie odpowiedzialności
Informacje i publikacje nie stanowią i nie powinny być traktowane jako porady finansowe, inwestycyjne, tradingowe ani jakiekolwiek inne rekomendacje dostarczane lub zatwierdzone przez TradingView. Więcej informacji znajduje się w Warunkach użytkowania.
Skrypt open-source
W zgodzie z duchem TradingView twórca tego skryptu udostępnił go jako open-source, aby użytkownicy mogli przejrzeć i zweryfikować jego działanie. Ukłony dla autora. Korzystanie jest bezpłatne, jednak ponowna publikacja kodu podlega naszym Zasadom serwisu.
Link Tree: linktr.ee/tradersendeavors
Access our indicators: patreon.com/user?u=80987417
Access our indicators: patreon.com/user?u=80987417
Wyłączenie odpowiedzialności
Informacje i publikacje nie stanowią i nie powinny być traktowane jako porady finansowe, inwestycyjne, tradingowe ani jakiekolwiek inne rekomendacje dostarczane lub zatwierdzone przez TradingView. Więcej informacji znajduje się w Warunkach użytkowania.