OPEN-SOURCE SCRIPT
Zaktualizowano liquidity volume

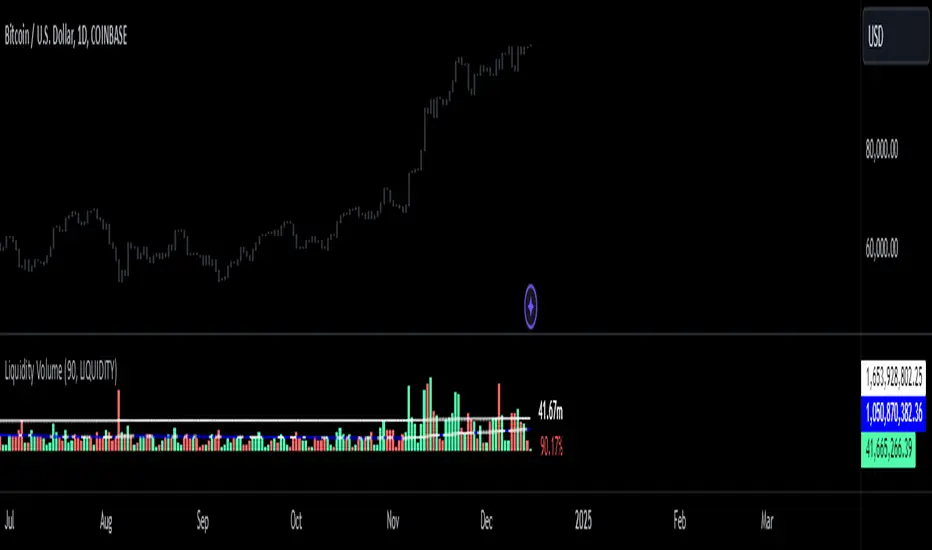
just like volume, this indicator shows how much in dollars were traded in millions.
Informacje o Wersji
made the volume bars represent colors based on bearish or bullish movementInformacje o Wersji
added a mean (average) to the script. Informacje o Wersji
added a 3rd standard deviation to the indicator. a 3sd occurrence has a 0.2% chance of occurrence on a statistical standpoint. but when it comes to markets it happens more often. nonetheless, a 3sd alert can signify a major market movement due to increase of activity of dollars going in or out of that asset you are observing. P.S.A. go on settings, under style tab, change the "price line" to a histogram. Informacje o Wersji
changed the plotted liqudity to a column Informacje o Wersji
when the line is purple that means that liquidity is going down. when the line is white that means liquidity is going up Informacje o Wersji
ive made improvements on the script. easier to use and readInformacje o Wersji
made a little bit more modificationInformacje o Wersji
you can switch from representation of liquidity and equity. equity is just normal volumeInformacje o Wersji
we have added a new stat. you can see how much volume has increased/decreased from the previous bar in percentageInformacje o Wersji
modified the separation of labels so no overlapping occursInformacje o Wersji
Skrypt open-source
W zgodzie z duchem TradingView twórca tego skryptu udostępnił go jako open-source, aby użytkownicy mogli przejrzeć i zweryfikować jego działanie. Ukłony dla autora. Korzystanie jest bezpłatne, jednak ponowna publikacja kodu podlega naszym Zasadom serwisu.
Wyłączenie odpowiedzialności
Informacje i publikacje nie stanowią i nie powinny być traktowane jako porady finansowe, inwestycyjne, tradingowe ani jakiekolwiek inne rekomendacje dostarczane lub zatwierdzone przez TradingView. Więcej informacji znajduje się w Warunkach użytkowania.