OPEN-SOURCE SCRIPT
Zaktualizowano Multi-Volume
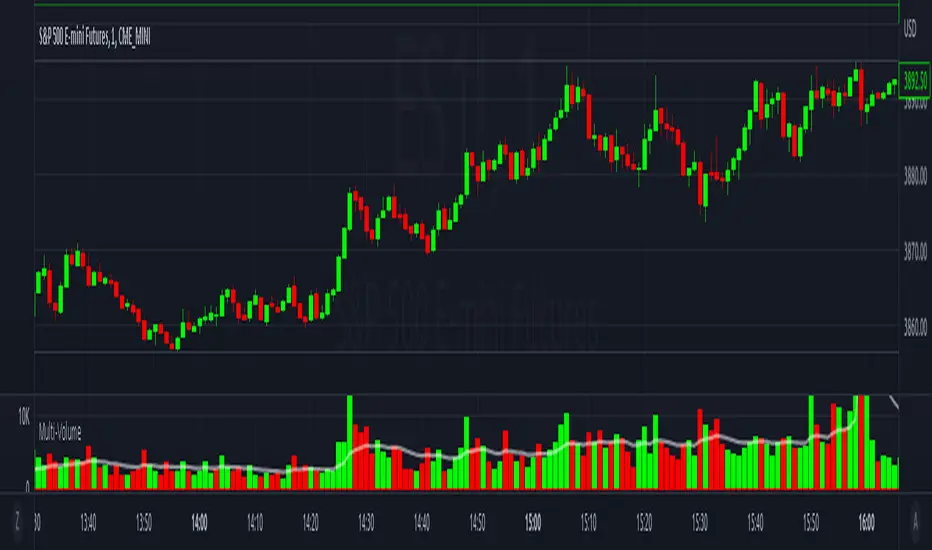
This indicator displays volume in several formats:
Volume Bar Format:
Flip Down Volume:
The down volume bar will be displayed below the center line.
Show Delta:
When selected with "Up/Down Volume" or "Volume Pressure", a small line will be displayed at the net volume (difference between up and down volume).
Projected Volume:
Instead of current volume, it will show expected volume at end of candle based on volume per second.
Volume Pressure:
On a green candle:
On a red candle:
To Update to Latest Version:
To update to the latest version, just close the indicator and add it again.
Volume Bar Format:
- Normal Volume: Shows the normal volume bar colors based on each candle's price direction
- Up/Down Volume: Breaks down each volume bar into buying volume (volume added when price goes up) and selling volume (volume added when price goes down)
- Volume Pressure: Breaks down each volume bar based on the length of the candle and its "pressure wick". See below for more information.
Flip Down Volume:
The down volume bar will be displayed below the center line.
Show Delta:
When selected with "Up/Down Volume" or "Volume Pressure", a small line will be displayed at the net volume (difference between up and down volume).
Projected Volume:
Instead of current volume, it will show expected volume at end of candle based on volume per second.
Volume Pressure:
On a green candle:
- The red part represents the upper wick, the volume as the price comes back down from its high
- The green part represents the rest of the candle, the volume as the price goes up from its low to the close
On a red candle:
- The green part represents the lower wick, the volume as the price comes back up from its low
- The red part represents the rest of the candle, the volume as the price goes down from its high to the close
To Update to Latest Version:
To update to the latest version, just close the indicator and add it again.
Informacje o Wersji
Added SMA, EMA and HMA moving averages for volume. When the Down volume is flipped, it will show separate moving averages for Up and Down volume.Informacje o Wersji
Fixed problem with volume bars jumping around when switching between tickers. Added a hidden scale line that keeps them relatively consistent.Skrypt open-source
W zgodzie z duchem TradingView twórca tego skryptu udostępnił go jako open-source, aby użytkownicy mogli przejrzeć i zweryfikować jego działanie. Ukłony dla autora. Korzystanie jest bezpłatne, jednak ponowna publikacja kodu podlega naszym Zasadom serwisu.
Wyłączenie odpowiedzialności
Informacje i publikacje nie stanowią i nie powinny być traktowane jako porady finansowe, inwestycyjne, tradingowe ani jakiekolwiek inne rekomendacje dostarczane lub zatwierdzone przez TradingView. Więcej informacji znajduje się w Warunkach użytkowania.
Skrypt open-source
W zgodzie z duchem TradingView twórca tego skryptu udostępnił go jako open-source, aby użytkownicy mogli przejrzeć i zweryfikować jego działanie. Ukłony dla autora. Korzystanie jest bezpłatne, jednak ponowna publikacja kodu podlega naszym Zasadom serwisu.
Wyłączenie odpowiedzialności
Informacje i publikacje nie stanowią i nie powinny być traktowane jako porady finansowe, inwestycyjne, tradingowe ani jakiekolwiek inne rekomendacje dostarczane lub zatwierdzone przez TradingView. Więcej informacji znajduje się w Warunkach użytkowania.