OPEN-SOURCE SCRIPT
US Party Rule Indicator
**Here's a description you can use for the indicator:**
**US Party Rule Indicator**
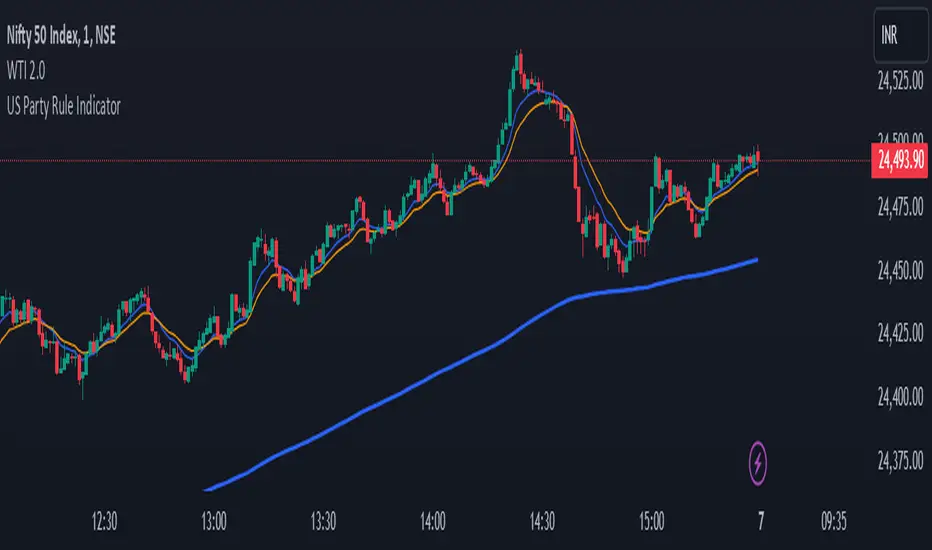
This indicator visually represents the political party in power in the United States over a specified period. It overlays a colored 200-day Exponential Moving Average (EMA) on the chart. The color of the EMA changes to reflect the ruling party, providing a visual representation of political influence on market trends.
**Key Features:**
- **Dynamic Color-Coded EMA:** The 200-EMA changes color to indicate the party in power (Red for Republican, Blue for Democrat).
- **Clear Visual Representation:** The colored EMA provides an easy-to-understand visual cue for identifying periods of different political parties.
- **Historical Context:** By analyzing the historical data, you can gain insights into potential correlations between party rule and market trends.
**How to Use:**
1. **Add the Indicator:** Add the "US Party Rule Indicator" to your chart.
2. **Interpret the Color:** The color of the 200-EMA indicates the ruling party at that time.
3. **Analyze Market Trends:** Use the indicator to identify potential correlations between political events and market movements.
**Note:** This indicator is for informational purposes only and should not be used as the sole basis for investment decisions. Always conduct thorough research and consider consulting with a financial advisor.
**US Party Rule Indicator**
This indicator visually represents the political party in power in the United States over a specified period. It overlays a colored 200-day Exponential Moving Average (EMA) on the chart. The color of the EMA changes to reflect the ruling party, providing a visual representation of political influence on market trends.
**Key Features:**
- **Dynamic Color-Coded EMA:** The 200-EMA changes color to indicate the party in power (Red for Republican, Blue for Democrat).
- **Clear Visual Representation:** The colored EMA provides an easy-to-understand visual cue for identifying periods of different political parties.
- **Historical Context:** By analyzing the historical data, you can gain insights into potential correlations between party rule and market trends.
**How to Use:**
1. **Add the Indicator:** Add the "US Party Rule Indicator" to your chart.
2. **Interpret the Color:** The color of the 200-EMA indicates the ruling party at that time.
3. **Analyze Market Trends:** Use the indicator to identify potential correlations between political events and market movements.
**Note:** This indicator is for informational purposes only and should not be used as the sole basis for investment decisions. Always conduct thorough research and consider consulting with a financial advisor.
Skrypt open-source
W zgodzie z duchem TradingView twórca tego skryptu udostępnił go jako open-source, aby użytkownicy mogli przejrzeć i zweryfikować jego działanie. Ukłony dla autora. Korzystanie jest bezpłatne, jednak ponowna publikacja kodu podlega naszym Zasadom serwisu.
Wyłączenie odpowiedzialności
Informacje i publikacje nie stanowią i nie powinny być traktowane jako porady finansowe, inwestycyjne, tradingowe ani jakiekolwiek inne rekomendacje dostarczane lub zatwierdzone przez TradingView. Więcej informacji znajduje się w Warunkach użytkowania.