OPEN-SOURCE SCRIPT
Horizontal EMA
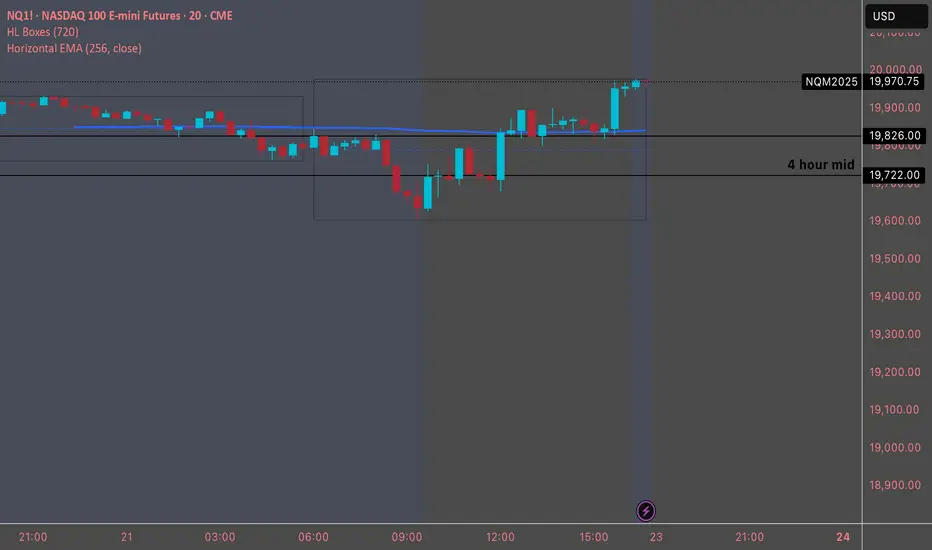
Designed to plot a horizontal Exponential Moving Average (EMA) line on a TradingView chart. The script allows users to specify the period and source for the EMA calculation. The line remains fixed at the calculated EMA value, providing a visual reference for the trend over the specified period. The script uses version 5 of Pine Script and draws a blue horizontal line at the EMA value on the chart, updating as new data is available.
Skrypt open-source
W zgodzie z duchem TradingView twórca tego skryptu udostępnił go jako open-source, aby użytkownicy mogli przejrzeć i zweryfikować jego działanie. Ukłony dla autora. Korzystanie jest bezpłatne, jednak ponowna publikacja kodu podlega naszym Zasadom serwisu.
Wyłączenie odpowiedzialności
Informacje i publikacje nie stanowią i nie powinny być traktowane jako porady finansowe, inwestycyjne, tradingowe ani jakiekolwiek inne rekomendacje dostarczane lub zatwierdzone przez TradingView. Więcej informacji znajduje się w Warunkach użytkowania.