OPEN-SOURCE SCRIPT
Divergence

Understanding the Divergence Indicator
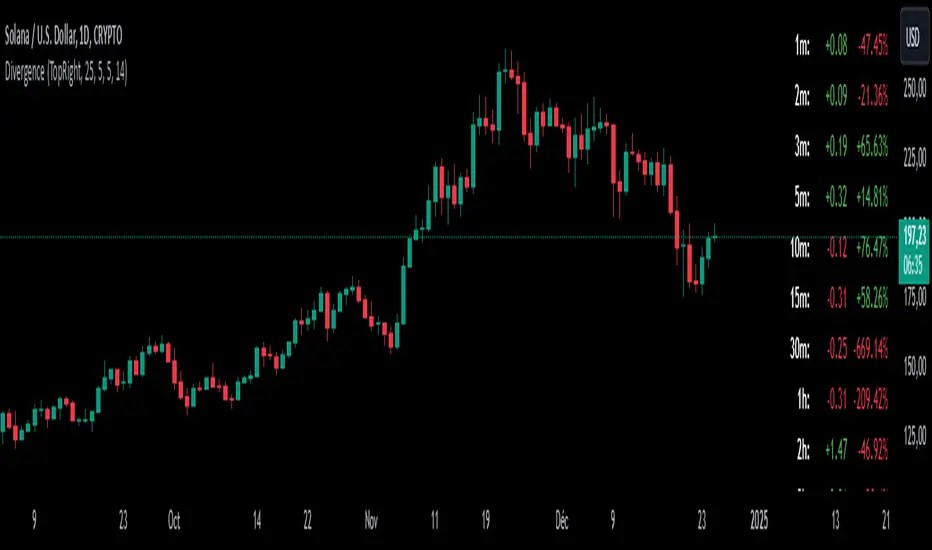
This indicator is designed to identify and analyze divergences between price action and multiple technical indicators across different timeframes. Divergence occurs when the price of an asset moves in one direction while a technical indicator moves in the opposite direction, potentially signaling a trend reversal or continuation.
Key Features
1. Customizable Parameters: Users can adjust settings for divergence detection, including:
- Bullish/Bearish divergence detection
- Regular/Hidden divergence identification
- Pivot lookback periods
- Weighting for different divergence types
2. Strength Calculation: The indicator calculates divergence strength based on the magnitude of divergence and user-defined weightings.
3. Visual Representation: Divergences are displayed on the chart with lines connecting price and indicator pivots, along with labels showing divergence strength.
Utility in Trading
1. Early Trend Reversal Signals: By identifying divergences, traders can anticipate potential trend reversals before they occur in price action.
2. Trend Continuation Confirmation: Hidden divergences can help confirm the continuation of an existing trend.
3. Multi-Timeframe Analysis: The indicator allows for divergence detection across various timeframes, enhancing the reliability of signals.
4. Risk Management: Traders can use divergence signals to adjust their stop-loss levels or take profits on existing positions.
5. Comprehensive Market View: By analyzing multiple indicators simultaneously, traders gain a more robust assessment of market conditions.
6. Objective Strength Evaluation: The divergence strength calculation provides an objective measure of signal significance.
By incorporating this divergence indicator into their trading strategy, traders can potentially improve their market timing, risk management, and overall trading performance.
Skrypt open-source
W zgodzie z duchem TradingView twórca tego skryptu udostępnił go jako open-source, aby użytkownicy mogli przejrzeć i zweryfikować jego działanie. Ukłony dla autora. Korzystanie jest bezpłatne, jednak ponowna publikacja kodu podlega naszym Zasadom serwisu.
Wyłączenie odpowiedzialności
Informacje i publikacje nie stanowią i nie powinny być traktowane jako porady finansowe, inwestycyjne, tradingowe ani jakiekolwiek inne rekomendacje dostarczane lub zatwierdzone przez TradingView. Więcej informacji znajduje się w Warunkach użytkowania.