PROTECTED SOURCE SCRIPT
Zaktualizowano EMA Double - Bollinger Bands (BB) & RSI
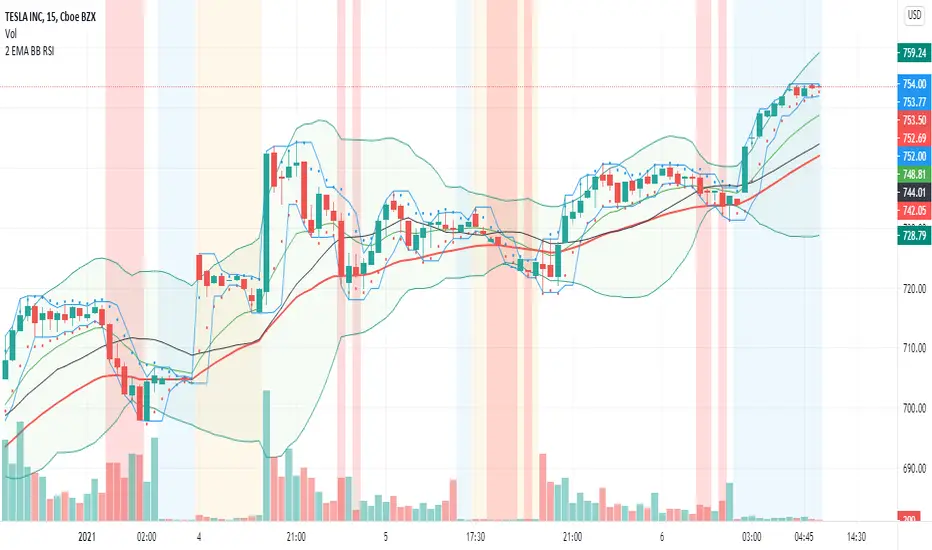
This Indicator (2 EMA -BB - RSI ) plots 2 EMA's along with Bollinger Bands and paints RSI Overbought & Oversold Zones on Chart.
RSI zones help quick identification of the overbought & oversold regions. RSI On/Off switch lets it Switch On & Off .
RSI zones help quick identification of the overbought & oversold regions. RSI On/Off switch lets it Switch On & Off .
Informacje o Wersji
Release 1.1Added Keltner Channel & Donchian channels for identifying volatility. Switch on KC/DC/BB Channels help to switch on/off .
The Keltner Channel is a moving average band indicator whose upper and lower bands adapt to changes in volatility by using the average true range.
The angle of the channel helps to identify trend direction. A rising channel means price has been rising, while a falling or sideways channel indicates price has been falling or moving sideways, respectively.
Keltner Channels use ATR to calculate the bands. Bollinger Bands use standard deviation instead.
The Donchian channel is an indicator used in market trading developed by Richard Donchian. It is formed by taking the highest high and the lowest low of the last n periods.
Informacje o Wersji
Published with Indicator specific chart.Skrypt chroniony
Ten skrypt został opublikowany jako zamknięty kod źródłowy. Możesz jednak używać go swobodnie i bez żadnych ograniczeń – więcej informacji tutaj.
Wyłączenie odpowiedzialności
Informacje i publikacje przygotowane przez TradingView lub jego użytkowników, prezentowane na tej stronie, nie stanowią rekomendacji ani porad handlowych, inwestycyjnych i finansowych i nie powinny być w ten sposób traktowane ani wykorzystywane. Więcej informacji na ten temat znajdziesz w naszym Regulaminie.
Skrypt chroniony
Ten skrypt został opublikowany jako zamknięty kod źródłowy. Możesz jednak używać go swobodnie i bez żadnych ograniczeń – więcej informacji tutaj.
Wyłączenie odpowiedzialności
Informacje i publikacje przygotowane przez TradingView lub jego użytkowników, prezentowane na tej stronie, nie stanowią rekomendacji ani porad handlowych, inwestycyjnych i finansowych i nie powinny być w ten sposób traktowane ani wykorzystywane. Więcej informacji na ten temat znajdziesz w naszym Regulaminie.