OPEN-SOURCE SCRIPT
Candle Price Movement
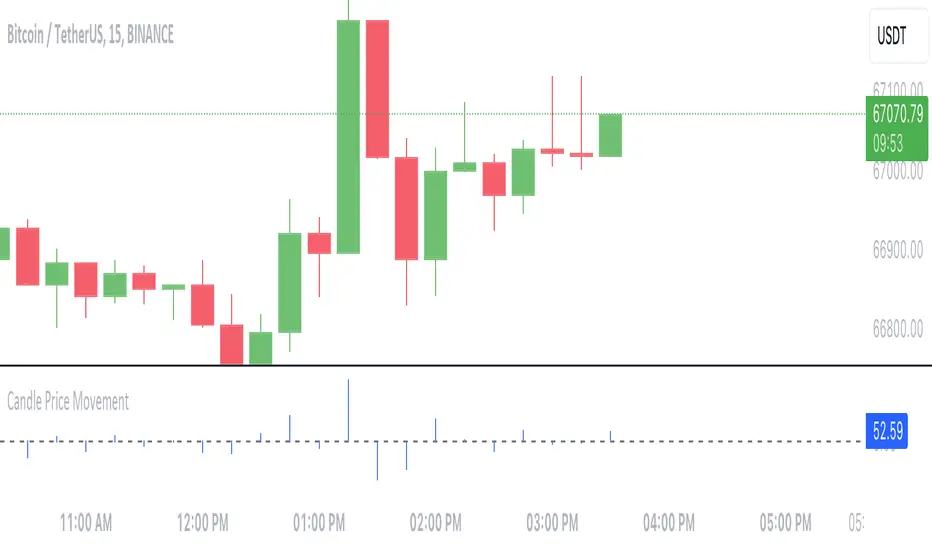
This Pine Script indicator calculates and visualizes the price movement for each candlestick on the chart.
- **Calculation**: The price movement for each candle is determined by subtracting the opening price from the closing price.
- **Visualization**: The price movement is plotted as a histogram, with positive values indicating upward movement (green bars) and negative values indicating downward movement (red bars).
- **Options**:
- The histogram bars are colored blue with zero opacity, providing a clear visual distinction from the background.
- A horizontal line at zero (the "Zero Line") is added for reference, helping to identify periods of no price movement.
---
This indicator provides traders with a quick visualization of the price movement for each candlestick, helping to identify trends and potential trading opportunities.
Skrypt open-source
W zgodzie z duchem TradingView twórca tego skryptu udostępnił go jako open-source, aby użytkownicy mogli przejrzeć i zweryfikować jego działanie. Ukłony dla autora. Korzystanie jest bezpłatne, jednak ponowna publikacja kodu podlega naszym Zasadom serwisu.
Wyłączenie odpowiedzialności
Informacje i publikacje nie stanowią i nie powinny być traktowane jako porady finansowe, inwestycyjne, tradingowe ani jakiekolwiek inne rekomendacje dostarczane lub zatwierdzone przez TradingView. Więcej informacji znajduje się w Warunkach użytkowania.