OPEN-SOURCE SCRIPT
Zaktualizowano Multiple SMAs
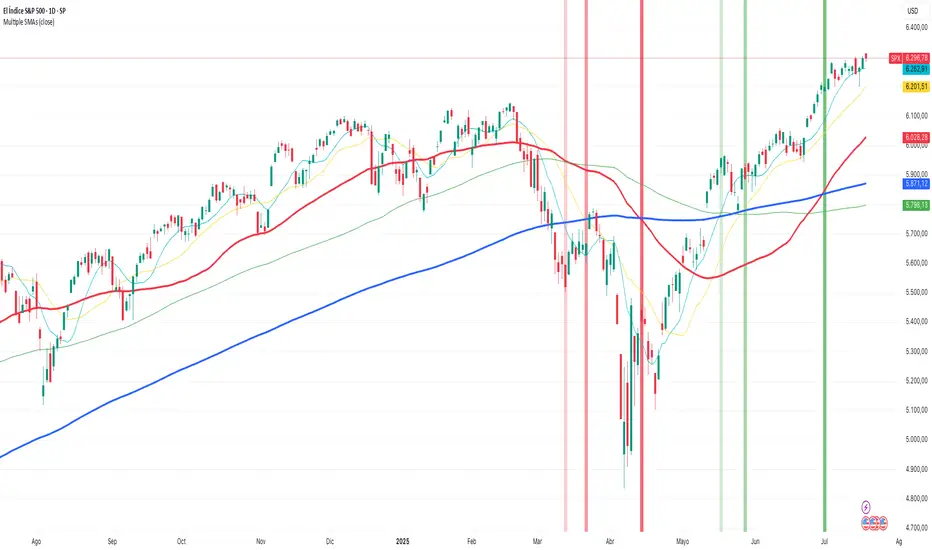
Plots multiple SMAs in a single indicator.
This script only plots the SMAs if the timeframe is set to daily.
- SMA10 in light blue
- SMA20 in yellow
- SMA50 in red
- SMA100 in green
- SMA200 in blue
It also plots the crosses between SMA20 and SMA50
This script only plots the SMAs if the timeframe is set to daily.
- SMA10 in light blue
- SMA20 in yellow
- SMA50 in red
- SMA100 in green
- SMA200 in blue
It also plots the crosses between SMA20 and SMA50
Informacje o Wersji
Plots multiple SMAs in a single indicator.This script only plots the SMAs if the timeframe is set to daily, weekly or monthly.
- SMA10 in light blue (daily or weekly)
- SMA20 in yellow (daily or weekly)
- SMA50 in red (daily or weekly)
- SMA100 in green
- SMA200 in blue
It also plots entry and exit alerts,
- Crosses between SMA10 and SMA200 (very light green/red vertical bar)
- Crosses between SMA20 and SMA200 (light green/red vertical bar)
- Crosses between SMA50 and SMA200 (green/red vertical bar)
Skrypt open-source
W zgodzie z duchem TradingView twórca tego skryptu udostępnił go jako open-source, aby użytkownicy mogli przejrzeć i zweryfikować jego działanie. Ukłony dla autora. Korzystanie jest bezpłatne, jednak ponowna publikacja kodu podlega naszym Zasadom serwisu.
Wyłączenie odpowiedzialności
Informacje i publikacje nie stanowią i nie powinny być traktowane jako porady finansowe, inwestycyjne, tradingowe ani jakiekolwiek inne rekomendacje dostarczane lub zatwierdzone przez TradingView. Więcej informacji znajduje się w Warunkach użytkowania.