OPEN-SOURCE SCRIPT
EMA Trend with MACD-Based Bar Coloring (Customized)
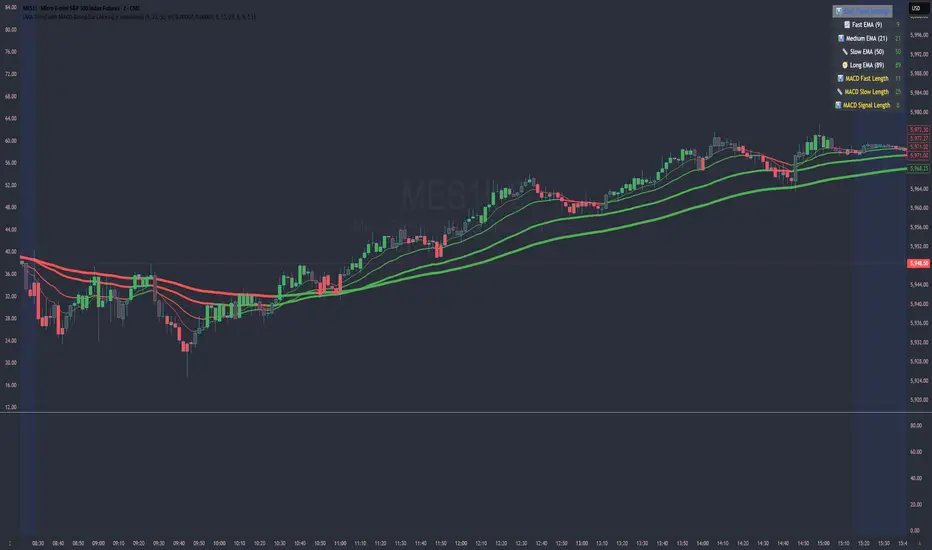
This indicator blends trend-following EMAs with MACD-based momentum signals to provide a visually intuitive view of market conditions. It's designed for traders who value clean, color-coded charts and want to quickly assess both trend direction and overbought/oversold momentum.
🔍 Key Features:
Multi-EMA Trend Visualization:
Includes four Exponential Moving Averages (EMAs):
Fast (9)
Medium (21)
Slow (50)
Long (89)
Each EMA is dynamically color-coded based on its slope—green for bullish, red for bearish, and gray for neutral—to help identify the trend strength and alignment at a glance.
MACD-Based Bar Coloring:
Candlesticks are colored based on MACD's relationship to its Bollinger Bands:
Green bars signal strong bullish momentum (MACD > Upper Band)
Red bars signal strong bearish momentum (MACD < Lower Band)
Gray bars reflect neutral conditions
Compact Visual Dashboard:
A clean, top-right table displays your current EMA and MACD settings, helping you track parameter configurations without opening the settings menu.
✅ Best Used For:
Identifying trend alignment across short- to medium-term timeframes
Filtering entries based on trend strength and MACD overextension
Enhancing discretion-based or rule-based strategies with visual confirmation
Skrypt open-source
W zgodzie z duchem TradingView twórca tego skryptu udostępnił go jako open-source, aby użytkownicy mogli przejrzeć i zweryfikować jego działanie. Ukłony dla autora. Korzystanie jest bezpłatne, jednak ponowna publikacja kodu podlega naszym Zasadom serwisu.
Wyłączenie odpowiedzialności
Informacje i publikacje nie stanowią i nie powinny być traktowane jako porady finansowe, inwestycyjne, tradingowe ani jakiekolwiek inne rekomendacje dostarczane lub zatwierdzone przez TradingView. Więcej informacji znajduje się w Warunkach użytkowania.