OPEN-SOURCE SCRIPT
Zaktualizowano Historical Volatility Bands [Loxx]
Historical Volatility Bands are constructed using:
What is Historical Volatility?
Historical Volatility (HV) is a statistical measure of the dispersion of returns for a given security or market index over a given period of time. Generally, this measure is calculated by determining the average deviation from the average price of a financial instrument in the given time period. Using standard deviation is the most common, but not the only, way to calculate Historical Volatility.
The higher the Historical Volatility value, the riskier the security. However, that is not necessarily a bad result as risk works both ways - bullish and bearish, i.e: Historical Volatility is not a directional indicator and should not be used as other directional indicators are used. Use to to determine the rising and falling price change volatility.
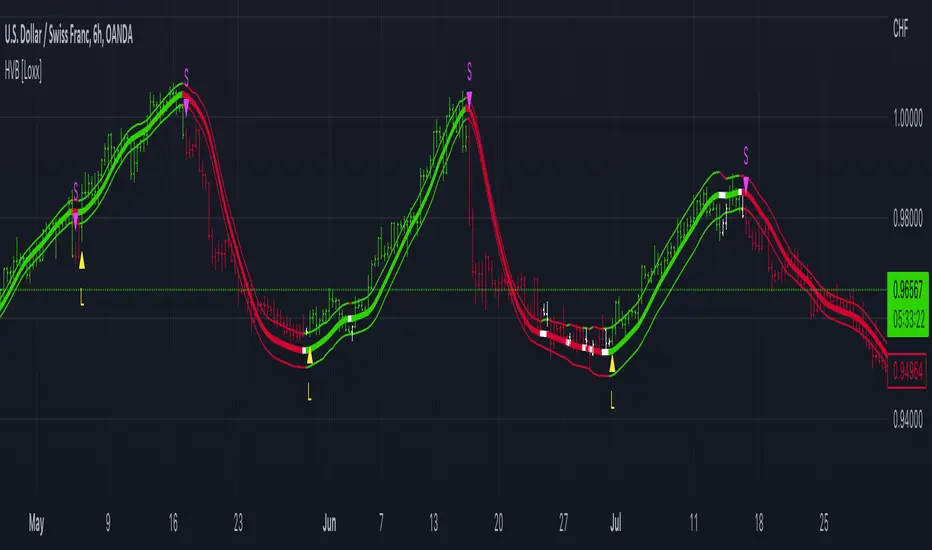
The color of the middle line, unlike the bands colors, has 3 colors. When colors of the bands are the same, then the middle line has the same color, otherwise it's white.
Included
- Average as the middle line.
- Upper and lower bands using the Historical Volatility for bands calculation.
What is Historical Volatility?
Historical Volatility (HV) is a statistical measure of the dispersion of returns for a given security or market index over a given period of time. Generally, this measure is calculated by determining the average deviation from the average price of a financial instrument in the given time period. Using standard deviation is the most common, but not the only, way to calculate Historical Volatility.
The higher the Historical Volatility value, the riskier the security. However, that is not necessarily a bad result as risk works both ways - bullish and bearish, i.e: Historical Volatility is not a directional indicator and should not be used as other directional indicators are used. Use to to determine the rising and falling price change volatility.
The color of the middle line, unlike the bands colors, has 3 colors. When colors of the bands are the same, then the middle line has the same color, otherwise it's white.
Included
- Alerts
- Signals
- Loxx's Expanded Source Types
- Bar coloring
Informacje o Wersji
Updated to handle all timeframes and all tickers. Skrypt open-source
W zgodzie z duchem TradingView twórca tego skryptu udostępnił go jako open-source, aby użytkownicy mogli przejrzeć i zweryfikować jego działanie. Ukłony dla autora. Korzystanie jest bezpłatne, jednak ponowna publikacja kodu podlega naszym Zasadom serwisu.
Public Telegram Group, t.me/algxtrading_public
VIP Membership Info: patreon.com/algxtrading/membership
VIP Membership Info: patreon.com/algxtrading/membership
Wyłączenie odpowiedzialności
Informacje i publikacje nie stanowią i nie powinny być traktowane jako porady finansowe, inwestycyjne, tradingowe ani jakiekolwiek inne rekomendacje dostarczane lub zatwierdzone przez TradingView. Więcej informacji znajduje się w Warunkach użytkowania.
Skrypt open-source
W zgodzie z duchem TradingView twórca tego skryptu udostępnił go jako open-source, aby użytkownicy mogli przejrzeć i zweryfikować jego działanie. Ukłony dla autora. Korzystanie jest bezpłatne, jednak ponowna publikacja kodu podlega naszym Zasadom serwisu.
Public Telegram Group, t.me/algxtrading_public
VIP Membership Info: patreon.com/algxtrading/membership
VIP Membership Info: patreon.com/algxtrading/membership
Wyłączenie odpowiedzialności
Informacje i publikacje nie stanowią i nie powinny być traktowane jako porady finansowe, inwestycyjne, tradingowe ani jakiekolwiek inne rekomendacje dostarczane lub zatwierdzone przez TradingView. Więcej informacji znajduje się w Warunkach użytkowania.