OPEN-SOURCE SCRIPT
EMA Ribbon - Adjustable with Toggles
📌 Script Name:
EMA Ribbon - Adjustable with Toggles
🧠 Primary Function:
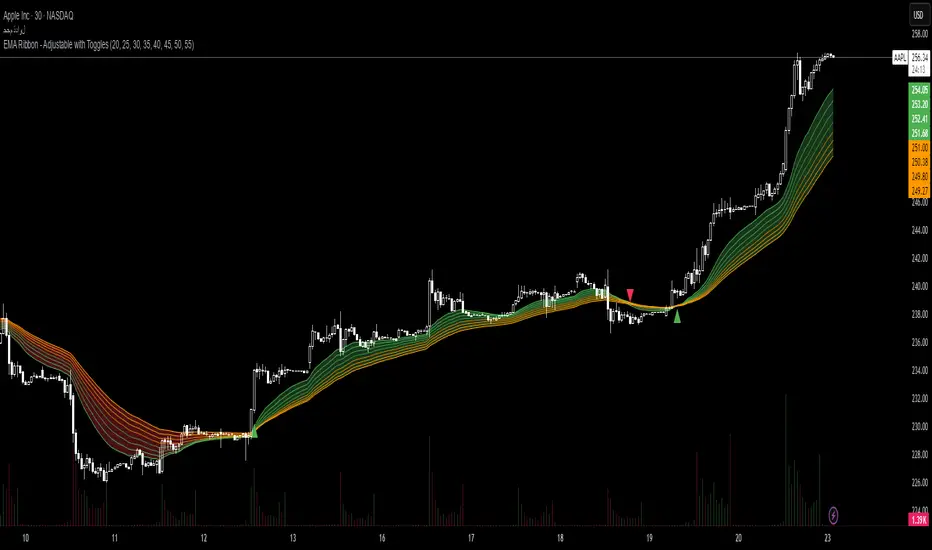
This script plots a customizable Exponential Moving Average (EMA) Ribbon on Trading View charts. It allows the user to enable or disable any of the 8 EMAs individually and shows buy/sell signals based on the crossover between the fastest and slowest EMAs.
⚙️ Key Features:
✅ User Controls:
Toggle ON/OFF each of the 8 EMAs independently.
Set the length of each EMA (from 1 upward).
EMA colors vary based on their speed (green for faster, orange for slower).
📈 EMA Calculation:
Calculates 8 separate EMAs using the closing price (close).
🎨 Chart Visualization:
Plots each EMA with a unique color and transparency.
Draws a colored ribbon between the highest and lowest active EMAs to visualize trend zones.
📊 Trend Direction Logic:
The trend is determined solely based on EMA 1 (fastest) and EMA 8 (slowest).
A bullish trend is when EMA 1 > EMA 8, and bearish when EMA 1 < EMA 8.
📍 Buy/Sell Signals:
Buy Signal: When the trend shifts from bearish to bullish (EMA 1 crosses above EMA 8).
Sell Signal: When the trend shifts from bullish to bearish (EMA 1 crosses below EMA 8).
Signals are displayed as green (buy) and red (sell) triangles on the chart.
🔔 Alerts:
Built-in alert conditions for buy and sell signals.
Custom alert messages in Arabic (can be modified if needed).
🌟 Additional Highlights:
Well-structured and easy to expand.
Great for trend-following strategies using EMA ribbons.
Helps identify consolidation zones and trend confirmation.
EMA Ribbon - Adjustable with Toggles
🧠 Primary Function:
This script plots a customizable Exponential Moving Average (EMA) Ribbon on Trading View charts. It allows the user to enable or disable any of the 8 EMAs individually and shows buy/sell signals based on the crossover between the fastest and slowest EMAs.
⚙️ Key Features:
✅ User Controls:
Toggle ON/OFF each of the 8 EMAs independently.
Set the length of each EMA (from 1 upward).
EMA colors vary based on their speed (green for faster, orange for slower).
📈 EMA Calculation:
Calculates 8 separate EMAs using the closing price (close).
🎨 Chart Visualization:
Plots each EMA with a unique color and transparency.
Draws a colored ribbon between the highest and lowest active EMAs to visualize trend zones.
📊 Trend Direction Logic:
The trend is determined solely based on EMA 1 (fastest) and EMA 8 (slowest).
A bullish trend is when EMA 1 > EMA 8, and bearish when EMA 1 < EMA 8.
📍 Buy/Sell Signals:
Buy Signal: When the trend shifts from bearish to bullish (EMA 1 crosses above EMA 8).
Sell Signal: When the trend shifts from bullish to bearish (EMA 1 crosses below EMA 8).
Signals are displayed as green (buy) and red (sell) triangles on the chart.
🔔 Alerts:
Built-in alert conditions for buy and sell signals.
Custom alert messages in Arabic (can be modified if needed).
🌟 Additional Highlights:
Well-structured and easy to expand.
Great for trend-following strategies using EMA ribbons.
Helps identify consolidation zones and trend confirmation.
Skrypt open-source
W zgodzie z duchem TradingView twórca tego skryptu udostępnił go jako open-source, aby użytkownicy mogli przejrzeć i zweryfikować jego działanie. Ukłony dla autora. Korzystanie jest bezpłatne, jednak ponowna publikacja kodu podlega naszym Zasadom serwisu.
Wyłączenie odpowiedzialności
Informacje i publikacje nie stanowią i nie powinny być traktowane jako porady finansowe, inwestycyjne, tradingowe ani jakiekolwiek inne rekomendacje dostarczane lub zatwierdzone przez TradingView. Więcej informacji znajduje się w Warunkach użytkowania.