OPEN-SOURCE SCRIPT
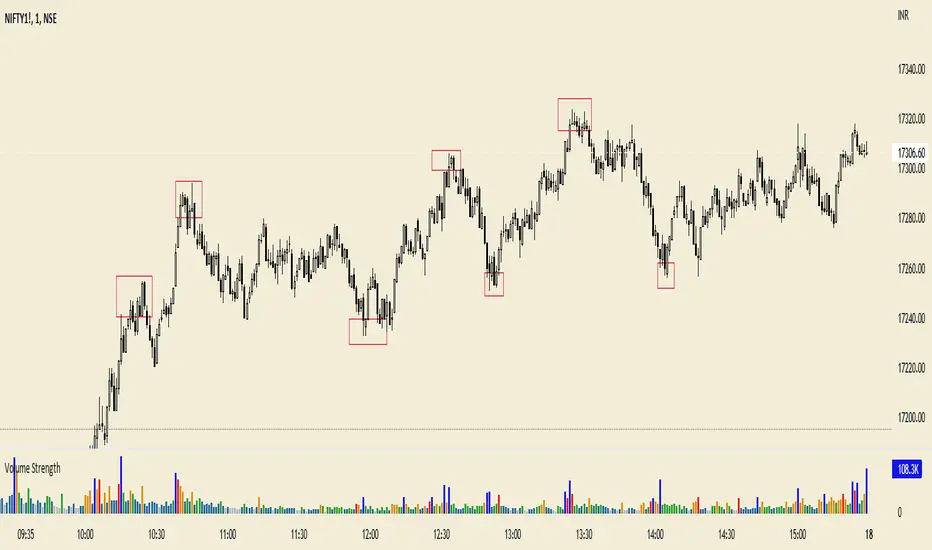
Volume HIGH/CLIMAX

Volume is the number of shares of a security traded during a given period of time.
Generally securities with more daily volume are more liquid than those without, since they are more "active".
Volume is an important indicator in technical analysis because it is used to measure the relative significance of a market move.
The higher the volume during a price move, the more significant the move and the lower the volume during a price move, the less significant the move.
A climax occurs at the end of a bull or bear market cycle and is characterized by escalated trading volume and sharp price movements.
Climaxes are usually preceded by extreme sentiment readings, either excessive euphoria at market peaks, or excessive pessimism at market bottoms.
Essentially, climaxes are a result of a resolution in supply and demand factors.
Buying Climaxes
One of the clearest signals of the end of a bull market is a buying climax, during which volume escalates to extreme levels and bullish euphoria permeates media coverage of stocks, market indices, or commodities . The key trait of a buying climax is the exhaustion of demand as the last buyers enter the market. The final surge of buying typically leads to price spikes, which may last for days, weeks, or months. As demand wanes, buyers become less willing to pay higher prices. There may be a brief period of stagnation in prices before a combination of profit-taking and new sellers set in motion the start of a sharp reversal.
Selling Climaxes
The beginning of a selling climax is often signaled by steadily increasing volume on the sell side of the market as growing pessimism accelerates the downtrend. As the selling climax approaches, the last buyers finally capitulate, driving shares sharply lower. Once the supply side of the market abates, demand at support levels can cause the price to level off before a combination of profit-taking and new buyers set in motion the start of a sharp reversal.
Skrypt open-source
W zgodzie z duchem TradingView twórca tego skryptu udostępnił go jako open-source, aby użytkownicy mogli przejrzeć i zweryfikować jego działanie. Ukłony dla autora. Korzystanie jest bezpłatne, jednak ponowna publikacja kodu podlega naszym Zasadom serwisu.
Wyłączenie odpowiedzialności
Informacje i publikacje nie stanowią i nie powinny być traktowane jako porady finansowe, inwestycyjne, tradingowe ani jakiekolwiek inne rekomendacje dostarczane lub zatwierdzone przez TradingView. Więcej informacji znajduje się w Warunkach użytkowania.