INVITE-ONLY SCRIPT
Zaktualizowano Extremes (Expo)
Extremes (Expo)
DESCRIPTION
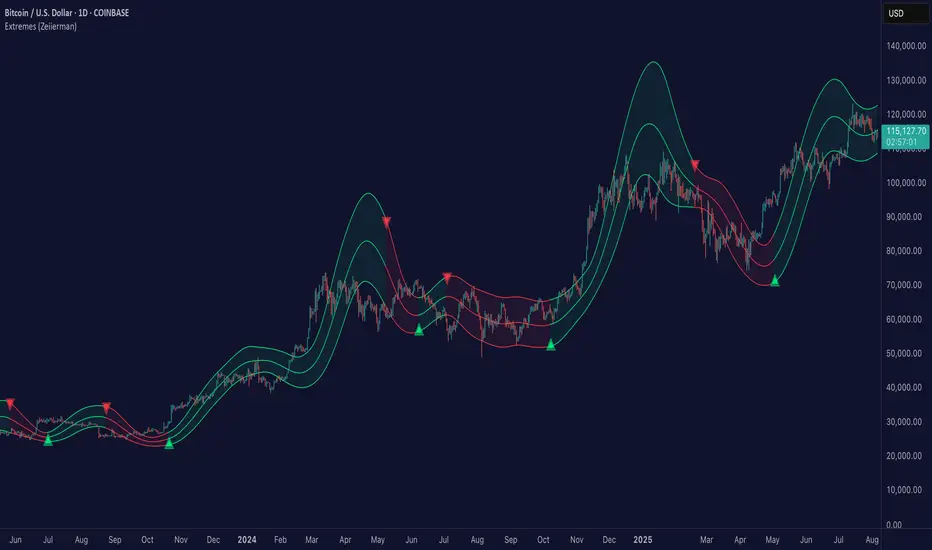
This Extreme (Expo) indicator identifies areas where the market is extreme. The length of the extreme calculation can be changed and gives you the flexibility to choose how sensitive the indicator should be. A longer length means that the indicator only identifies bold extremes. A shorter length is more sensitive and thus identifies all extremes in the market.
When the market is in an extreme mode, keep your trade until the extreme mode ends.
Postive extreme is when the price is above the positive extreme lines. (Keep your long trade until the positive extreme ends).
Negative extreme is when the price is below the negative extreme lines. (Keep your short trade until the negative extreme ends).
The Extremes (Expo) can be used to visualize the trend. Price crossing indicates a directional change. Price can also bounce off the extremes lines, which can act as dynamic support and resistance. It is often used in combination with other signals and analysis techniques.
TREND
The indictor has a Trend- feature that can be switched on which identifies trend shifts as well as trend direction.
A positive trend is when all three trendlines are green, and when the price is at least above one of these three lines.
A Negative trend is when all three trendlines are red, and when the price is at least under one of these three lines.
When the color of the trend lines changes color it indicates that the trend might shift direction. When all three trendlines have shifted color a trend is established.
PULLBACK
A bonus feature that is added to the trend-setting is that it can detect pullbacks in trends. This is visualized by that one of the three trendlines change color. For instance, say that all 3 lines are red (negative trend) and one of these lines changes color to green it can be regarded as a pullback in the negative trend.
HOW TO USE
1. Use the indicator to identify extreme areas.
2. Use the indicator to identify trends.
3. Use the indicator to identify trend shifts.
4. Use the indicator to identify pullbacks in trends.
INDICATOR IN ACTION
EXTREMES
BTCUSD

BTCUSD

TESLA

WALL STREET

TREND & PULLBACK
WALL STREET

EURUSD

I hope you find this indicator useful, and please comment or contact me if you like the script or have any questions/suggestions for future improvements. Thanks!
I will continue to work on this indicator, so please share your experience and feedback with me so that I can continuously improve it. Thanks to everyone that have contacted me regarding my scripts. Your feedback is valuable for future developments!
ACCESS THE INDICATOR
• Contact me on TradingView or use the links below
-----------------
Disclaimer
Copyright by Zeiierman.
The information contained in my scripts/indicators/ideas does not constitute financial advice or a solicitation to buy or sell any securities of any type. I will not accept liability for any loss or damage, including without limitation any loss of profit, which may arise directly or indirectly from use of or reliance on such information.
All investments involve risk, and the past performance of a security, industry, sector, market, financial product, trading strategy, or individual’s trading does not guarantee future results or returns. Investors are fully responsible for any investment decisions they make. Such decisions should be based solely on an evaluation of their financial circumstances, investment objectives, risk tolerance, and liquidity needs.
My scripts/indicators/ideas are only for educational purposes!
DESCRIPTION
This Extreme (Expo) indicator identifies areas where the market is extreme. The length of the extreme calculation can be changed and gives you the flexibility to choose how sensitive the indicator should be. A longer length means that the indicator only identifies bold extremes. A shorter length is more sensitive and thus identifies all extremes in the market.
When the market is in an extreme mode, keep your trade until the extreme mode ends.
Postive extreme is when the price is above the positive extreme lines. (Keep your long trade until the positive extreme ends).
Negative extreme is when the price is below the negative extreme lines. (Keep your short trade until the negative extreme ends).
The Extremes (Expo) can be used to visualize the trend. Price crossing indicates a directional change. Price can also bounce off the extremes lines, which can act as dynamic support and resistance. It is often used in combination with other signals and analysis techniques.
TREND
The indictor has a Trend- feature that can be switched on which identifies trend shifts as well as trend direction.
A positive trend is when all three trendlines are green, and when the price is at least above one of these three lines.
A Negative trend is when all three trendlines are red, and when the price is at least under one of these three lines.
When the color of the trend lines changes color it indicates that the trend might shift direction. When all three trendlines have shifted color a trend is established.
PULLBACK
A bonus feature that is added to the trend-setting is that it can detect pullbacks in trends. This is visualized by that one of the three trendlines change color. For instance, say that all 3 lines are red (negative trend) and one of these lines changes color to green it can be regarded as a pullback in the negative trend.
HOW TO USE
1. Use the indicator to identify extreme areas.
2. Use the indicator to identify trends.
3. Use the indicator to identify trend shifts.
4. Use the indicator to identify pullbacks in trends.
INDICATOR IN ACTION
EXTREMES
BTCUSD
BTCUSD
TESLA
WALL STREET
TREND & PULLBACK
WALL STREET
EURUSD
I hope you find this indicator useful, and please comment or contact me if you like the script or have any questions/suggestions for future improvements. Thanks!
I will continue to work on this indicator, so please share your experience and feedback with me so that I can continuously improve it. Thanks to everyone that have contacted me regarding my scripts. Your feedback is valuable for future developments!
ACCESS THE INDICATOR
• Contact me on TradingView or use the links below
-----------------
Disclaimer
Copyright by Zeiierman.
The information contained in my scripts/indicators/ideas does not constitute financial advice or a solicitation to buy or sell any securities of any type. I will not accept liability for any loss or damage, including without limitation any loss of profit, which may arise directly or indirectly from use of or reliance on such information.
All investments involve risk, and the past performance of a security, industry, sector, market, financial product, trading strategy, or individual’s trading does not guarantee future results or returns. Investors are fully responsible for any investment decisions they make. Such decisions should be based solely on an evaluation of their financial circumstances, investment objectives, risk tolerance, and liquidity needs.
My scripts/indicators/ideas are only for educational purposes!
Informacje o Wersji
Performance ImprovementsJoin Our Free Discord: discord.gg/zeiiermantrading
Access my indicators at: linktr.ee/zeiierman_trading
Earn $15
tradingview.com/gopro/?share_your_love=Zeiierman
SMC Trading
linktr.ee/zeiierman_trading
Access my indicators at: linktr.ee/zeiierman_trading
Earn $15
tradingview.com/gopro/?share_your_love=Zeiierman
SMC Trading
linktr.ee/zeiierman_trading
Skrypt tylko na zaproszenie
Dostęp do tego skryptu mają tylko użytkownicy upoważnieni przez autora i zazwyczaj wiąże się z opłatą. Możesz dodać go do ulubionych, ale będziesz mógł z niego korzystać dopiero po uzyskaniu zgody jego autora. Skontaktuj się z Zeiierman po więcej informacji lub postępuj zgodnie z instrukcjami autora poniżej.
TradingView nie sugeruje płacenia za skrypt i korzystania z niego, jeśli nie ufasz w 100% jego autorowi i nie rozumiesz, jak działa skrypt. W wielu przypadkach możesz znaleźć dobrą alternatywę open-source za darmo w naszych Skryptach Społeczności.
Instrukcje autora
″Get instant access here: https://zeiiermantrading.com/
Chcesz użyć tego skryptu na wykresie?
Ostrzeżenie: przeczytaj to zanim poprosisz o dostęp.
Join Our Free Discord: discord.gg/zeiiermantrading
Access my indicators at: linktr.ee/zeiierman_trading
Earn $15
tradingview.com/gopro/?share_your_love=Zeiierman
SMC Trading
linktr.ee/zeiierman_trading
Access my indicators at: linktr.ee/zeiierman_trading
Earn $15
tradingview.com/gopro/?share_your_love=Zeiierman
SMC Trading
linktr.ee/zeiierman_trading
Wyłączenie odpowiedzialności
Informacje i publikacje przygotowane przez TradingView lub jego użytkowników, prezentowane na tej stronie, nie stanowią rekomendacji ani porad handlowych, inwestycyjnych i finansowych i nie powinny być w ten sposób traktowane ani wykorzystywane. Więcej informacji na ten temat znajdziesz w naszym Regulaminie.