OPEN-SOURCE SCRIPT
Spread Analysis (COIN/BTC)
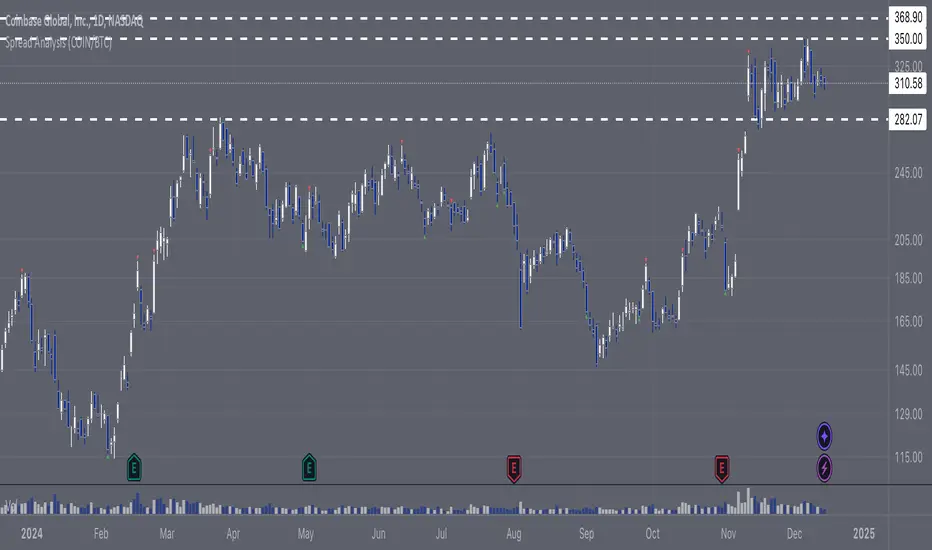
The Spread Analysis (COIN/BTC) indicator calculates the Z-score of the price ratio between Coinbase stock ( COIN) and Bitcoin (
 BTC). It helps identify overbought or oversold conditions based on deviations from the historical mean of their price relationship.
Key Features:
Z-Score Calculation:
• Tracks the relative price ratio ofCOIN to $BTC.
• Compares the current ratio to its historical average, highlighting extreme overvaluation or undervaluation.
• Buy and Sell Signals:
• Buy Signal: Triggered when the Z-score is less than -2, indicatingCOIN may be undervalued relative to $BTC.
• Sell Signal: Triggered when the Z-score exceeds 2, suggestingCOIN may be overvalued relative to $BTC.
• Dynamic Z-Score Visualization:
• Blue line plots the Z-score over time.
• Dashed lines at +2 and -2 mark overbought and oversold thresholds.
• Green and red triangles highlight actionable buy and sell signals.
Use Case:
This indicator is ideal for identifying relative valuation opportunities betweenCOIN and $BTC. Use it to exploit divergences in their historical relationship and anticipate potential reversions to the mean.
Limitations:
• Best suited for range-bound markets; may produce false signals in strongly trending conditions.
• Assumes a consistent correlation betweenCOIN and BTC, which may break during independent price drivers like news or earnings.
Key Features:
Z-Score Calculation:
• Tracks the relative price ratio of
• Compares the current ratio to its historical average, highlighting extreme overvaluation or undervaluation.
• Buy and Sell Signals:
• Buy Signal: Triggered when the Z-score is less than -2, indicating
• Sell Signal: Triggered when the Z-score exceeds 2, suggesting
• Dynamic Z-Score Visualization:
• Blue line plots the Z-score over time.
• Dashed lines at +2 and -2 mark overbought and oversold thresholds.
• Green and red triangles highlight actionable buy and sell signals.
Use Case:
This indicator is ideal for identifying relative valuation opportunities between
Limitations:
• Best suited for range-bound markets; may produce false signals in strongly trending conditions.
• Assumes a consistent correlation between
Skrypt open-source
W zgodzie z duchem TradingView twórca tego skryptu udostępnił go jako open-source, aby użytkownicy mogli przejrzeć i zweryfikować jego działanie. Ukłony dla autora. Korzystanie jest bezpłatne, jednak ponowna publikacja kodu podlega naszym Zasadom serwisu.
Wyłączenie odpowiedzialności
Informacje i publikacje nie stanowią i nie powinny być traktowane jako porady finansowe, inwestycyjne, tradingowe ani jakiekolwiek inne rekomendacje dostarczane lub zatwierdzone przez TradingView. Więcej informacji znajduje się w Warunkach użytkowania.