Mean Reversion Period Tracker [acatwithwithcharts]
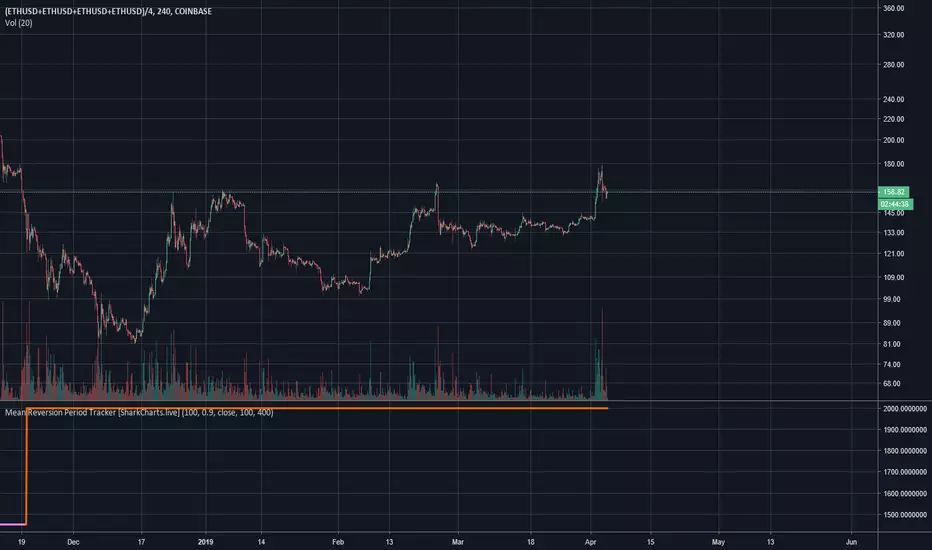
This version caps the maximum period length at 2000 for the complete range of the full Mean Reversion MA indicator. The display color also changes to orange when the period is maxed out as a warning that the maximum has been reached and that the true further overexpanded period is likely to be further out.
I am posting this as invite-only and have a short list of collaborators in mind who will get access if they want it. It is not being made available to the general public as of this posting; I’m vaguely working towards eventually offering being able to offer some sort of paid indicator offering in the future.
Rather than shut the door entirely, I will say that if someone approaches me by PM with a really interesting idea on how they’d like to test this or my other indicators, I’m willing to consider giving access. I’m not giving this away just to anyone who asks and will, for my own time and sanity, probably just ignore requests by people who don't come to me already knowing what this indicator does and how they might want to use it.
I'm excited to announce that we're putting the finishing touches on a subscription service for the volatility theory indicators, and assuming no hiccups will launch them within days. Subscriptions will be available in several packages through SharkCharts.live
Current pricing and subscription details will be kept up-to-date on SharkCharts.live
Skrypt tylko na zaproszenie
Dostęp do tego skryptu mają wyłącznie użytkownicy zatwierdzeni przez autora. Aby z niego korzystać, należy poprosić o zgodę i ją uzyskać. Zgoda jest zazwyczaj udzielana po dokonaniu płatności. Więcej informacji można znaleźć w instrukcjach autora poniżej lub kontaktując się bezpośrednio z acatwithcharts.
TradingView NIE zaleca płacenia za skrypt ani korzystania z niego, jeśli nie ma pełnego zaufania do jego autora i nie rozumie się zasad jego działania. Można również znaleźć darmowe, otwartoźródłowe alternatywy w skryptach społeczności.
Instrukcje autora
Feel free to reach out to me with any questions; more information is available on the SharkCharts website and the SharkCharts discord discord.gg/YVpTeSK
Wyłączenie odpowiedzialności
Skrypt tylko na zaproszenie
Dostęp do tego skryptu mają wyłącznie użytkownicy zatwierdzeni przez autora. Aby z niego korzystać, należy poprosić o zgodę i ją uzyskać. Zgoda jest zazwyczaj udzielana po dokonaniu płatności. Więcej informacji można znaleźć w instrukcjach autora poniżej lub kontaktując się bezpośrednio z acatwithcharts.
TradingView NIE zaleca płacenia za skrypt ani korzystania z niego, jeśli nie ma pełnego zaufania do jego autora i nie rozumie się zasad jego działania. Można również znaleźć darmowe, otwartoźródłowe alternatywy w skryptach społeczności.
Instrukcje autora
Feel free to reach out to me with any questions; more information is available on the SharkCharts website and the SharkCharts discord discord.gg/YVpTeSK