OPEN-SOURCE SCRIPT
Big Candle Touches Bollinger Band

What It Does:
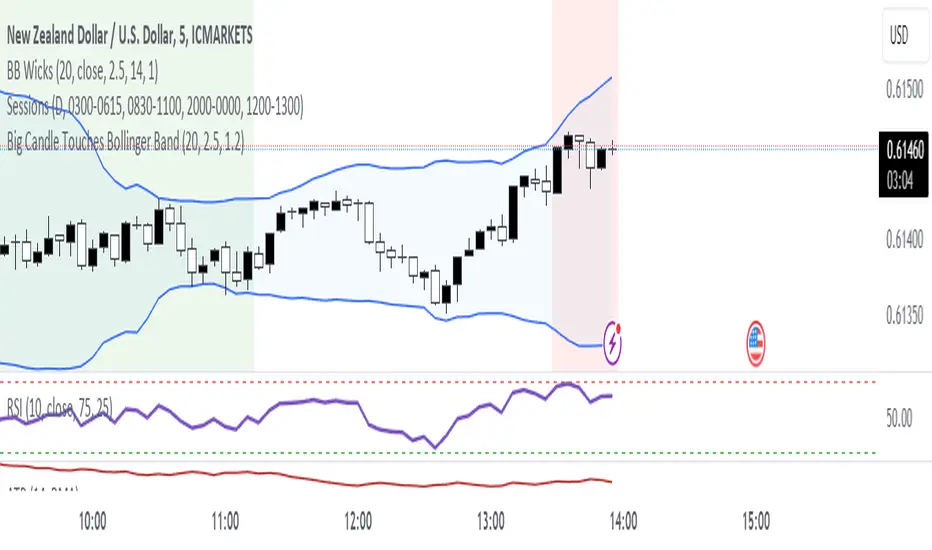
This indicator helps you spot important trading signals by combining Bollinger Bands with big candles.
Key Features:
Bollinger Bands: These bands show the average price (middle band) and the range of price movement (upper and lower bands) over a set period. The bands widen when prices are more volatile and narrow when they are less volatile.
Big Candle Detection: A "big candle" is a candle that has a larger body compared to the average price movement over a period. This is determined using the Average True Range (ATR), which measures market volatility.
How It Works:
Detects Big Candles: It checks if a candle’s body (the difference between its open and close prices) is bigger than usual, based on a multiplier of the ATR.
Touching Bollinger Bands: It looks for candles that touch or cross the upper or lower Bollinger Bands.
Highlights Important Signals:
Sell Signal: When a big candle touches the upper Bollinger Band, it marks it as a "Sell" signal with a red label.
Buy Signal: When a big candle touches the lower Bollinger Band, it marks it as a "Buy" signal with a green label.
Alerts:
You'll get alerts when a big candle touches the upper or lower Bollinger Bands, so you don’t miss these potential trading opportunities.
Visuals:
Bollinger Bands: Shown as three lines on the chart — the upper band (red), the lower band (green), and the middle band (blue).
Labels: Red labels for sell signals and green labels for buy signals when a big candle touches the bands.
This indicator helps you identify potential trading opportunities by focusing on significant price movements and how they interact with the Bollinger Bands.
Wyłączenie odpowiedzialności
Informacje i publikacje przygotowane przez TradingView lub jego użytkowników, prezentowane na tej stronie, nie stanowią rekomendacji ani porad handlowych, inwestycyjnych i finansowych i nie powinny być w ten sposób traktowane ani wykorzystywane. Więcej informacji na ten temat znajdziesz w naszym Regulaminie.