OPEN-SOURCE SCRIPT
Moving average to price cloud
Hi all!
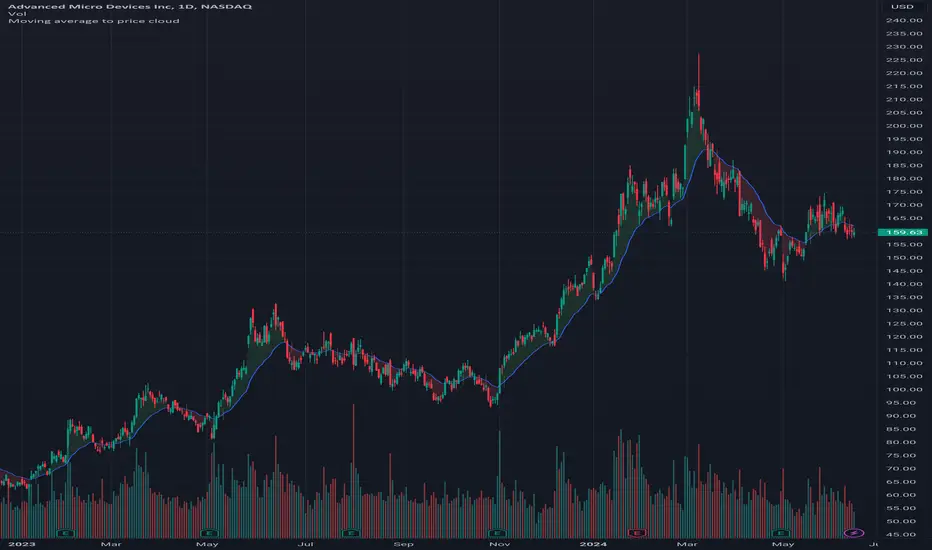
This indicator shows when the price crosses the defined moving average. It plots a green or red cloud (depending on trend) and the moving average. It also plots an arrow when the trend changes (this can be disabled in 'style'->'labels' in the settings).
The moving average itself can be used as dynamic support/resistance. The trend will change based on your settings (described below). By default the trend will change when the whole bar is above/below the moving average for 2 bars (that's closed). This can be changed by "Source" and "Bars".
Settings
• Length (choose the length of the moving average. Defaults to 21)
• Type (choose what type of moving average).
- "SMA" (Simple Moving Average)
- "EMA" (Exponential Moving Average)
- "HMA" (Hull Moving Average)
- "WMA" (Weighted Moving Average)
- "VWMA" (Volume Weighted Moving Average)
- "DEMA" (Double Exponential Moving Average)
Defaults to"EMA".
• Source (Define the price source that must be above/below the moving average for the trend to change. Defaults to 'High/low (passive)')
- 'Open' The open of the bar has to cross the moving average
- 'Close' The close of the bar has to cross the moving average
- 'High/low (passive)' In a down trend: the low of the bar has to cross the moving average
- 'High/low (aggressive)' In a down trend: the high of the bar has to cross the moving average
• Source bar must be close. Defaults to 'true'.
• Bars (Define the number bars whose value (defined in 'Source') must be above/below the moving average. All the bars (defined by this number) must be above/below the moving average for the trend to change. Defaults to 2.)
Let me know if you have any questions.
Best of trading luck!
Skrypt open-source
W zgodzie z duchem TradingView twórca tego skryptu udostępnił go jako open-source, aby użytkownicy mogli przejrzeć i zweryfikować jego działanie. Ukłony dla autora. Korzystanie jest bezpłatne, jednak ponowna publikacja kodu podlega naszym Zasadom serwisu.
Wyłączenie odpowiedzialności
Informacje i publikacje nie stanowią i nie powinny być traktowane jako porady finansowe, inwestycyjne, tradingowe ani jakiekolwiek inne rekomendacje dostarczane lub zatwierdzone przez TradingView. Więcej informacji znajduje się w Warunkach użytkowania.