Blokblok usdt daily analyses
time frame daily
long position risk of ratio >9
target 0.00075$
if price breaks the upper line my long position will start. duration of this forecast is long
if it cannot break and move between orange lines my short position will be active. this duration is short
short position risk of ratio >2
target 0.00027$
Pump

Last Leg of The Bull RunBased on historical patterns, I believe we are in the final phase of the current bull run. Analyzing previous market cycles, the peak of the 2013 bull run to the 2017 peak had a 49-month bar separation, while the 2017 to 2021 cycle exhibited a 47-month separation. Following this established “-2” pattern, the next peak is likely to occur with a 45-month separation.
Additionally, we are currently positioned within a monthly fair value gap, which could drive the market to new highs. However, I remain skeptical about the sustainability of this rally due to the impact of the U.S. crypto reserve. Institutional investors may perceive this as an opportunity for exit liquidity, aligning with the well-known market principle: "Buy the hype, sell the news."
- Gavin
do your own research
not financial advice just a speculation

Crypto.com (CRO)Cro usdt Daily analysis
Time frame daily
Risk rewards ratio >5.3 👈👌
Nothing to say
Chart is clear
Red line is historical support line

xrpxrp usdt daily analyses
time frame daily
look at the chart
xrp is moving up and down slowly. when all of assets fall down in two week before , ripple was excepted
so I think if xrp break the red box (strong resistance) it can move to moon and my first target is 4.86$

Conspicuous - MANA / USDTEvening fellow traders,
Every now and then I ride waves on MANA.
This time it won't be different, as I am already in it.
But I'm looking for an extra touch, that outta the box type thing and buying an extra chunk between the prices shown in the chart.
Please take advantage of this if you get the chance, and let's make a big chunk of money together!
Trade thirsty, my friends!

POPCATUSDT is setting up for a potential long opportunity!
🚀 The price BINANCE:POPCATUSDT.P is testing a critical support level at 0.2056 USDT , and if bulls hold, we could see a strong upward push.
🔑 Key Levels:
Support:
- 0.2056 USDT – Key support, maintaining the trend.
- 0.2010 USDT – Deep liquidity zone for potential wicks.
Resistance:
- 0.2200 USDT – Short-term target for scalpers.
- 0.2774 USDT – Major resistance; breaking above could trigger a rally.
🚀 Trading Strategy:
Long Entry: On a clear bounce from 0.2056 USDT with volume confirmation.
Stop-Loss: Below 0.2010 USDT to avoid liquidity grabs.
Profit Targets:
- 0.2200 USDT – First take-profit for quick gains.
- 0.2500 USDT – Solid mid-term target.
- 0.2774 USDT – Full extension if momentum builds.
📊 Technical Outlook:
- The trend remains bullish as long as support holds.
- Increased volume at support suggests whale accumulation.
- A break below 0.2010 USDT may invalidate the bullish setup.
💡 What to Watch?
- Volume spikes = strong bullish interest.
- Retest of support with a strong bounce = long entry signal.
- Manage risk and avoid FOMO!

Bitcoin Final UpdateEverything on the charts...
Up to you now... Yes... I believe it's just Reaccumulation
Look at the previous posts for more explanation and all perspectives
I'm holding and I'm bullish...We will witness an alt season this year (those saying we won't will be proven wrong...)
BTC.D will fall and strong alts will rise (with massive returns)
Until Next Time...

DOT 10x Possibility Very SoonHello once again friends,
Here's a coin that I'll long for a nice 10X from the lows.
Make sure to scoop some out, because its a solid project.
Trade thirsty!

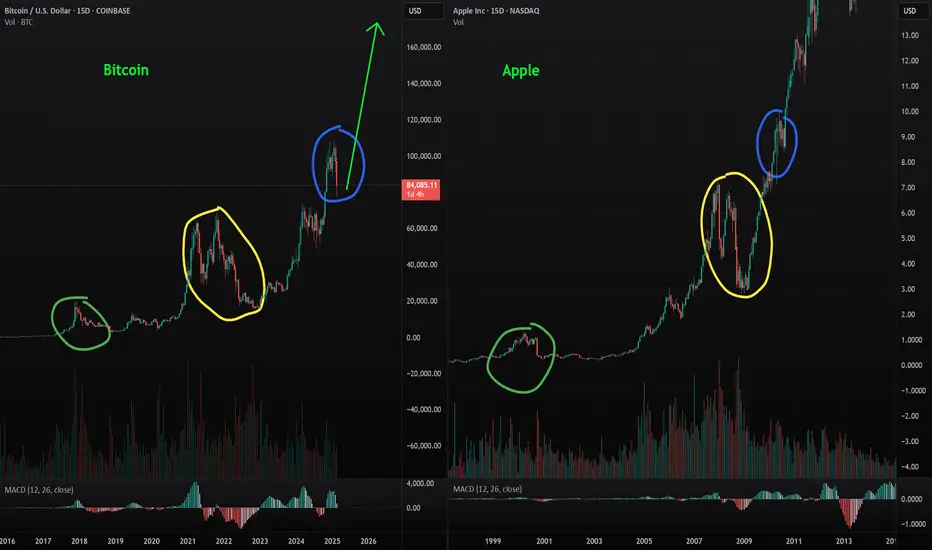
Don't lose sight of what is about to happen with Bitcoin.Bitcoin will blow investors away. Be ready for an expansion that most investors are simply not anticipating. This growth could be massive. Please don't lose sight of what’s coming.
Stay profitable.
– Dalin Anderson
BTCUSD: Fvg to be FIlled?Hello. Relatively new in the BTC field, any feedback will be appreciated.
As seen on my chart, im expecting price to come back and fill a FVG formed on a recent dump. Seems that we have a somewhat decent bullish trend.
My entry is based on liquidity, currently set at 96206, but I am aware we might see a stop hunt slightly below.
First TP was set on a possible liq sweep reversal point since market does not really have a strong direction as of now, and Second TP is at the fvg start point.
SL is set right below a lower high to avoid getting stopped from a stop hunt, if it reaches said point.
Please, let me see your thoughts and if possible, to get feedback and learn more together:)

Binance coinBnb usdt Daily analysis
Time frame daily
Risk rewards ratio >2.3 👈
Target 830$
Technical analysis 👇
Look at the chart carefully
Bnb is moving between two gray lines and down side of this is strong support line
Three parts of Correction is finished and price start the fist part of moving.

SolanaSol usdt Daily analysis
Time frame daily
Risk rewards ratio =3 👈👌
My target= 303 $
Technical analysis
Let's take a look at the chart. The price is between two ascending diagonal lines. At times it has approached the upper line but has not touched it and has turned back. But the lower line has become a good support and can give us a signal that the price will not go lower than this. This support has worked well even in severe declines.

makermkr usdt daily analyses
time frame daily
risk rewards ratio>8
maker is a good asset which I have in my watchlist
chart is clear
we have a Descending triangle and price is ready to pump and reaches my target on 1734$
we have a very important event on Wednesday and all of traders and investors are waiting for that news.
I guess that we will have a good news but also I am ready for everything
my LS is very tight and I am online 4hours before of event to watch closely and carefully

SHIB1000USDT: Reversal or Breakdown?
📉 BYBIT:SHIB1000USDT.P is currently trading at a critical support zone around 0.019900 USDT . After multiple tests of this level, buyers are stepping in, but is it enough to trigger a rally?
---
🔑 Key Levels:
Support:
0.018347 USDT — the last support level, a breakdown here could lead to further downside.
0.019825 USDT — current liquidity accumulation area.
Resistance:
0.022000 USDT — the first target in case of a bounce.
0.026403 USDT — a liquidity zone that could act as a magnet if the price breaks through local resistances.
---
🚩 Trading Strategy:
Entry Point:
- Consider a long position if 0.019825 USDT holds with increasing volume.
Stop-Loss:
- Below 0.018347 USDT to minimize risks in case of a breakdown.
Take-Profit Targets:
0.022000 USDT — first target for partial profit-taking.
0.026403 USDT — potential target if a bullish impulse kicks in.
---
📈 Technical Analysis:
The price is testing a support level with repeated buyer reactions.
A breakout could trigger a recovery phase with potential movement towards 0.026403 USDT.
If the support fails, a drop to 0.018347 USDT is likely.
---
💡 Conclusion:
The price is at a crossroads: a bounce could yield great profits, but a breakdown could spell trouble. Stay alert! What’s your take? Waiting for a retest or already in? Let’s discuss in the comments! 🚀

CHoCH (Change of Character) in Crypto TradingWhat is CHoCH?
CHoCH (Change of Character) is a concept from Smart Money Concept (SMC) used in technical analysis. It signals a shift in market behavior and often marks the beginning of a new trend phase, whether a trend reversal or consolidation.
Unlike Break of Structure (BoS), which confirms trend continuation, CHoCH indicates a potential change in direction.
---
How to Identify CHoCH?
1. In an Uptrend:
Price forms Higher Highs (HH) and Higher Lows (HL).
If the price breaks the last HL but fails to create a new HH, this is CHoCH, signaling a potential bearish reversal.
2. In a Downtrend:
Price forms Lower Lows (LL) and Lower Highs (LH).
If the price breaks the last LH but does not form a new LL, this is CHoCH, suggesting a bullish reversal.
---
How to Trade CHoCH?
CHoCH is a powerful tool for spotting trend weakness and entering trades early.
1. Spotting Trend Weakness:
In an uptrend, if the price fails to make a new HH and breaks the last HL, a trend shift might be occurring.
In a downtrend, if the price fails to form a new LL and breaks the last LH, expect bullish momentum.
2. Entry Strategies After CHoCH:
Wait for confirmation with a retest of the key level.
Use volume indicators to check if the breakout is significant.
Enter the trade after the retest of the broken support/resistance level.
3. Combining CHoCH with Other Tools:
CHoCH works well with Order Blocks, Liquidity Zones, and Fair Value Gaps (FVG).
Volume analysis helps confirm institutional activity in the trend change.
---
CHoCH Trading Example
Imagine an uptrend where price forms Higher Highs (HH) and Higher Lows (HL). Suddenly, the price fails to create a new HH and breaks the last HL. This is CHoCH, suggesting a potential shift from bullish to bearish.
💡 Traders can use this signal to exit long positions and prepare for short setups.

GrinGrin usdt Daily analysis
Time frame daily
Risk rewards ratio >3.2 👈👌
Red line is historical support line
Grey line is a short time resistance line that broke before . So trade on this asset has a good benefit for even amateur traders

Curve (crv)Crv usdt Daily analysis
Time frame 2hours
Risk rewards ratio >2.3 👌👈
Technical analysis
CRV is caught in a triangle. In similar cases, the price breaks out from the bottom or top of the triangle.And we'll have to wait and see where it comes from.
But why is my analysis a bullish one?
This bullish analysis is solely for the purpose of examining market sentiment.
Given the positive news we hear in the cryptocurrency market and the positive sentiment of buyers in this market, we come to this bullish analysis.
Risk rewards ratio is another good point for this analysis
Ratio 2.3 makes me a brave heart analyzer.
Only by introducing a false selling pressure can this analysis be failed. So , I put my LS in correct place. Of course I know the power of stop hunters.

TURBOUSDT: Breakout Incoming or Another Fakeout?
Hey traders! Today we’re watching BINANCE:TURBOUSDT.P The price is consolidating around 0.0084450 USDT , testing a key resistance level. We’re seeing a classic ascending triangle forming — a textbook pattern before a big move. Will we see a breakout, or is this just another fakeout?
---
🔑 Key Levels:
Support:
0.0082000 USDT — a key level where buyers could step in again.
0.0080000 USDT — the last line of defense before a potential drop.
Resistance:
0.0087261 USDT — the first barrier keeping price in check.
0.0087928 USDT — the final line before a potential surge.
---
🚩 Trading Strategy:
Entry Point:
- Long entry on a confirmed breakout above 0.0087261 USDT with volume confirmation.
Stop-Loss:
- Place a stop below 0.0082000 USDT to avoid unnecessary drawdowns.
Take-Profit Targets:
0.0087928 USDT — the first level to lock in some profits.
0.0090000 USDT — a target in case of a strong impulse.
---
📈 Technical Analysis:
An ascending triangle is forming, signaling potential accumulation.
Increasing volume near resistance indicates strong buyer interest.
If the breakout fails, we may see a retest of support before another attempt.
---
💡 Conclusion:
This setup looks promising, but confirmation is key. What do you think? Seeing order book liquidity or potential rejection signs? Let’s discuss in the comments!

BnB is on the wayBnb usdt Daily analysis
Time frame 4hours
Target 900$
Close Target is upperside of the band
We hear a lot of news about major crypto companies collaborating, as well as corporate acquisitions and filling the coffers with valuable cryptocurrencies.
But there is no volume in the market.
We are not seeing the growth that we expect to hear after all this good news.😒
What is the reason?
The answer is one word.
👉Strategic patience. 👈
Wait, this is the beginning. The rockets are refueling for a long, long launch.🚀🚀🚀

Graphlinq (GLQ)Glq usdt Daily analysis
Time frame daily
Risk rewards ratio >3.2 👈👌
As I said
As I said, the blue rectangle you see on the chart is an important area. The price has touched the historical trendline and the RSI indicator is at the bottom.
What more sign do you want?
Enjoy 300% profit

NEIROUSDT: Is the Market Ready for a Breakout?
Hello, traders! Today we’re analyzing $NEIROUSDT. The chart is showing an upward trend with key resistance at 0.0008378 USDT . The current price sits at 0.0008189 USDT , and the market appears poised for a move. Will it be a pump, or are we in for a pullback?
---
🔑 Key Levels:
Support:
0.0008100 USDT — a zone where buyers may hold the market steady.
0.0007800 USDT — a backup support level in case of a dip.
Resistance:
0.0008378 USDT — the critical level that must break for continued growth.
0.0008700 USDT — a profit-taking target after the breakout.
---
🚩 Trading Strategy:
Entry Point:
- Consider going long after a confirmed breakout above 0.0008378 USDT with volume confirmation.
Stop-Loss:
- Place your stop below 0.0008100 USDT to minimize risk.
Take-Profit Targets:
0.0008500 USDT — the first target for partial profit-taking.
0.0008700 USDT — the final target for this move.
---
📈 Technical Analysis:
The upward trend signals increasing buyer interest.
Volumes are gradually increasing, confirming bullish intentions.
If the price consolidates above 0.0008378 USDT , it could trigger a significant impulse.
---
💡 Conclusion:
The NEIROUSDT market is at a critical decision point. Will buyers maintain control, or are we heading for a pullback? Share your thoughts in the comments and keep an eye on key levels!

tron (TRX)trx usdt daily analyses
time frame 4 hours
risk riwards ratio > 3.5 (woooow)
****** ( My condolences to those who lost their lives in the California fires.) *******
there is no volume in the market yet.
RSI is in the bottom of chart
price is in the down side of triangle and sellers couldn't break the support line ( 0.225$)
I set LS on the down of another support line on 0.195$
if we hear a good news about cryptocurrency market or tron , maybe a pump happens and good benefit for traders.
be careful for stop hunters. in this situations

ETHUSDT: Attempting a Recovery After the Dump
Hey, traders! Today, we’re focusing on $ETHUSDT. The price is trying to recover after a sharp dump, currently sitting at 3,345.52 USDT . We see a support level at 3,308.46 USDT , which has held up under pressure, but its retention remains critical.
---
🔑 Key Levels:
Support:
3,308.46 USDT — the key zone where buyers might keep the market steady.
3,302.52 USDT — an additional defense level in case of renewed pressure.
Resistance:
3,360.00 USDT — the nearest target to test the bulls' strength.
3,400.00 USDT — a zone for partial profit-taking if the upward momentum continues.
---
🚩 Trading Strategy:
Entry Point:
- Consider a long position after confirming the support at 3,308.46 USDT and observing a bullish impulse.
Stop-Loss:
- Place your stop below 3,302.52 USDT to minimize risks.
Take-Profit Targets:
3,360.00 USDT — the first profit-taking point.
3,400.00 USDT — the final target for this upward move.
---
📈 Technical Analysis:
The sharp volume dump indicates a liquidity grab attempt.
If bulls can hold the 3,308.46 USDT level, recovery toward resistance is possible.
It’s important to monitor volume and price reaction at key levels.
---
💡 Conclusion:
Ethereum is clearly attempting to recover after a strong dump, but buyers must hold support. Will the market manage to reclaim lost ground? Share your thoughts in the comments!
