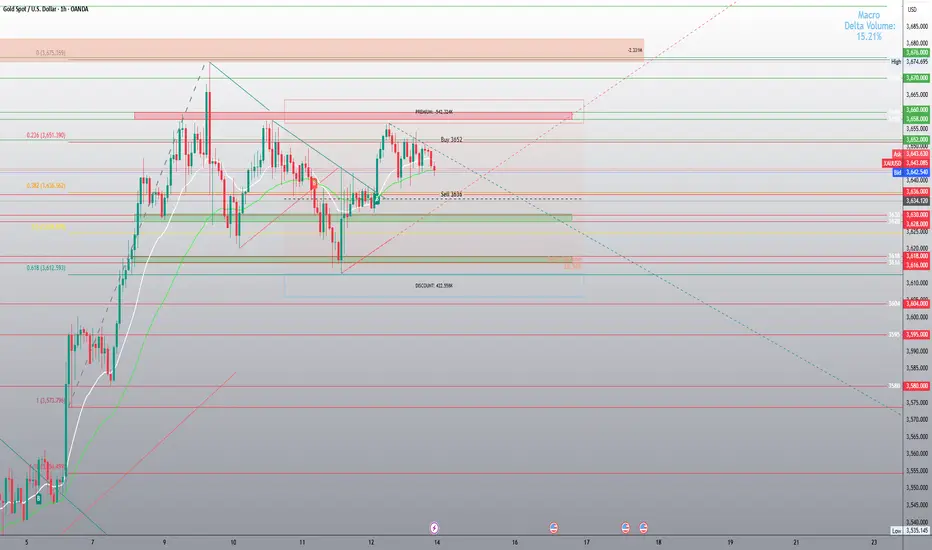
Buy @ 3652
Sell @ 3636
Here’s the analysis:
1. Buy level: 3652
This sits just above the 0.382 Fib retracement (~3650–3651) from the prior swing.
Price has been consolidating around this Fib cluster and the moving average ribbon, so buying at 3652 is a momentum continuation idea if price reclaims and holds above this level.
Upside targets:
First resistance ~3674–3675 (previous swing high).
Beyond that, 3680–3685 (upper green zone), then potential extension toward 3700.
Risk: This buy entry is vulnerable if price rejects at Fib 0.382 and rolls over — in that case, you could get trapped at the top of a range.
2. Sell level: 3636
This lines up with horizontal structure + mid-zone support.
It’s also just above a deeper retracement area (0.5–0.618 zone around 3630–3612).
A sell trigger here suggests you’re looking for a breakdown below consolidation, aiming for:
First target: 3620–3616
Deeper target: 3595–3580 (red zone below).
Risk: If price bounces from the 0.5–0.618 retracement (classic golden pocket), your short may get squeezed.
3. Macro context from this chart
Macro Delta Volume = +15% (top-right): suggests buyers still have an edge.
Current bias seems to favor buy dips rather than short breakdowns, unless we see strong selling momentum below 3630.
The broad structure looks like a bullish consolidation inside Fib retracement, but the market is choppy — meaning both levels are logical as tactical plays, depending on breakout direction.
✅ Summary
Buy 3652: good if price reclaims momentum above Fib 0.382 → targets 3675–3685+.
Sell 3636: works only if price closes below 3630 (break of support) → targets 3616 then 3595–3580.
Overall bias leans bullish as long as gold holds above 3612 (Fib 0.618) — but be ready to flip short if that level gives way.
As always use proper risk management on these trades , take profit ans start securing at 20+ pips
Zlecenie aktywne
Buy 128 pips sell 93 pips trade running
Uwaga
Buy running 360 pipsTransakcja zamknięta: osiągnięto wyznaczony cel
Wyłączenie odpowiedzialności
Informacje i publikacje przygotowane przez TradingView lub jego użytkowników, prezentowane na tej stronie, nie stanowią rekomendacji ani porad handlowych, inwestycyjnych i finansowych i nie powinny być w ten sposób traktowane ani wykorzystywane. Więcej informacji na ten temat znajdziesz w naszym Regulaminie.