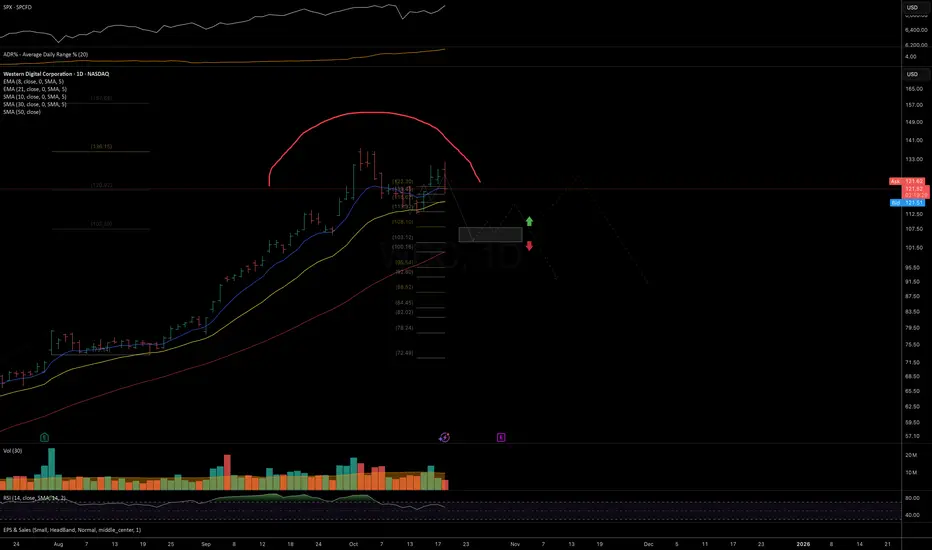
Price continues to act in line with the trend structure suggested in the October analysis. As long as price remains below today’s low, I’m watching for downside continuation toward the 108–103 support zone in the short term, with potentially lower targets in the mid-term.
Chart:
Previously:
On downside potential (Oct 9):
Chart:
see in weekly review: https://www.tradingview.com/chart/BITF/MXF8r9gK-Weekly-Chart-Review-Oct-6-10-2025/
Chart:
Previously:
On downside potential (Oct 9):
Chart:
see in weekly review: https://www.tradingview.com/chart/BITF/MXF8r9gK-Weekly-Chart-Review-Oct-6-10-2025/
Uwaga
Chart:
📊 Daily FREE Market Insights | Crypto + US Stocks
⚡ Technical analysis, setups & commentary
🌍 t.me/MarketArtistryENG | 🇷🇺 t.me/marketartistry
⚡ Technical analysis, setups & commentary
🌍 t.me/MarketArtistryENG | 🇷🇺 t.me/marketartistry
Powiązane publikacje
Wyłączenie odpowiedzialności
Informacje i publikacje nie stanowią i nie powinny być traktowane jako porady finansowe, inwestycyjne, tradingowe ani jakiekolwiek inne rekomendacje dostarczane lub zatwierdzone przez TradingView. Więcej informacji znajduje się w Warunkach użytkowania.