US10Y: Signals Deeper Drop as Rate Cut Hopes Build
US10Y: Signals Deeper Drop as Rate Cut Hopes Build
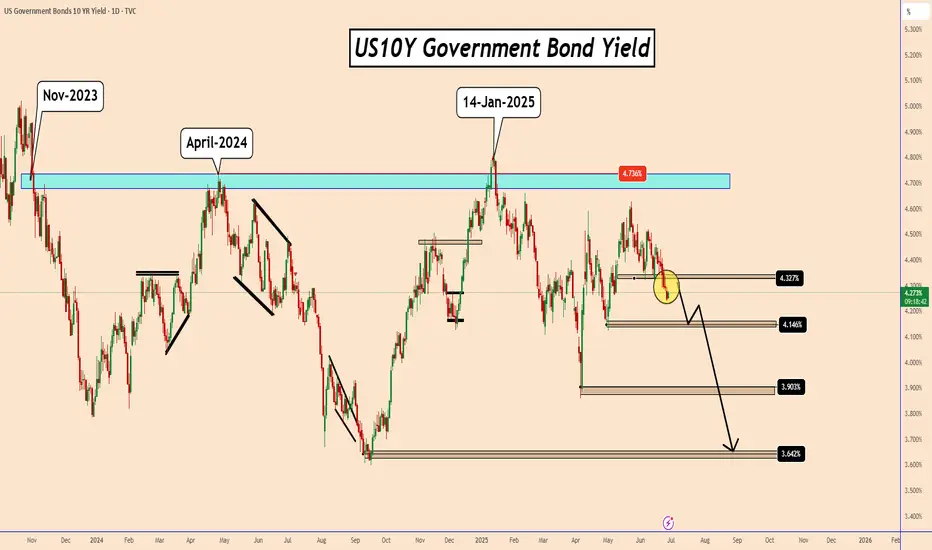
The U.S. 10-Year Treasury Yield (US10Y) has broken decisively below a key daily structure zone near 4.32%, marking a significant technical breakdown. If price action holds beneath this level, it increases the probability of a further slide toward 4.14% and potentially 3.09%—levels last seen in early April 2025.
From a broader perspective, the yield could eventually decline toward 3.64%, dating back to early September 2024.
This bearish momentum may begin unfolding today, especially if the PCE data hints at a potential Fed rate cut. During recent testimonies, Chair Powell emphasized a data-dependent approach, yet didn’t dismiss the possibility of a rate cut in the July meeting.
Interestingly, despite US10Y's decline, it may still provide temporary support for the U.S. dollar (USD) in these volatile conditions. The correlation between US10Y and the USD has weakened in recent months. Let's see what happens.
You may find more details in the chart!
Thank you and Good Luck!
PS: Please support with a like or comment if you find this analysis useful for your trading day
✅MY FREE Signals Channel
t.me/TradingPuzzles
✅Personal Telegram
t.me/KlejdiCuni
✅Suggested News Channel
t.me/ForexNewsNavigator_Official
t.me/TradingPuzzles
✅Personal Telegram
t.me/KlejdiCuni
✅Suggested News Channel
t.me/ForexNewsNavigator_Official
Wyłączenie odpowiedzialności
Informacje i publikacje przygotowane przez TradingView lub jego użytkowników, prezentowane na tej stronie, nie stanowią rekomendacji ani porad handlowych, inwestycyjnych i finansowych i nie powinny być w ten sposób traktowane ani wykorzystywane. Więcej informacji na ten temat znajdziesz w naszym Regulaminie.