Multi-Timeframe Analysis / Natural Gas Futures by ThinkingAntsOk
Use this as a guide to develop your view:
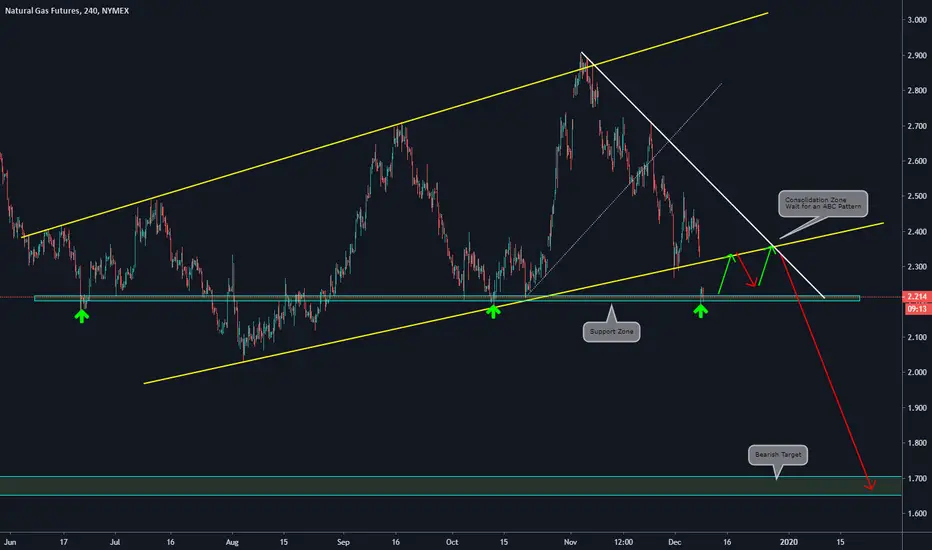
Main items we can observe on the 4HS chart:
a)Price has broken the primary structure (yellow lines) with a bearish movement
b)The price found support on the 2.20 level
c)We Expect an ABC formation with a pullback to the broken structure
d)If the ABC formation happens, we forecast a continuation of the bearish movement towards the next support zone at the 1.7 level
Daily Vision:

Weekly Vision:

Main items we can observe on the 4HS chart:
a)Price has broken the primary structure (yellow lines) with a bearish movement
b)The price found support on the 2.20 level
c)We Expect an ABC formation with a pullback to the broken structure
d)If the ABC formation happens, we forecast a continuation of the bearish movement towards the next support zone at the 1.7 level
Daily Vision:
Weekly Vision:
Wyłączenie odpowiedzialności
Informacje i publikacje nie stanowią i nie powinny być traktowane jako porady finansowe, inwestycyjne, tradingowe ani jakiekolwiek inne rekomendacje dostarczane lub zatwierdzone przez TradingView. Więcej informacji znajduje się w Warunkach użytkowania.
Wyłączenie odpowiedzialności
Informacje i publikacje nie stanowią i nie powinny być traktowane jako porady finansowe, inwestycyjne, tradingowe ani jakiekolwiek inne rekomendacje dostarczane lub zatwierdzone przez TradingView. Więcej informacji znajduje się w Warunkach użytkowania.