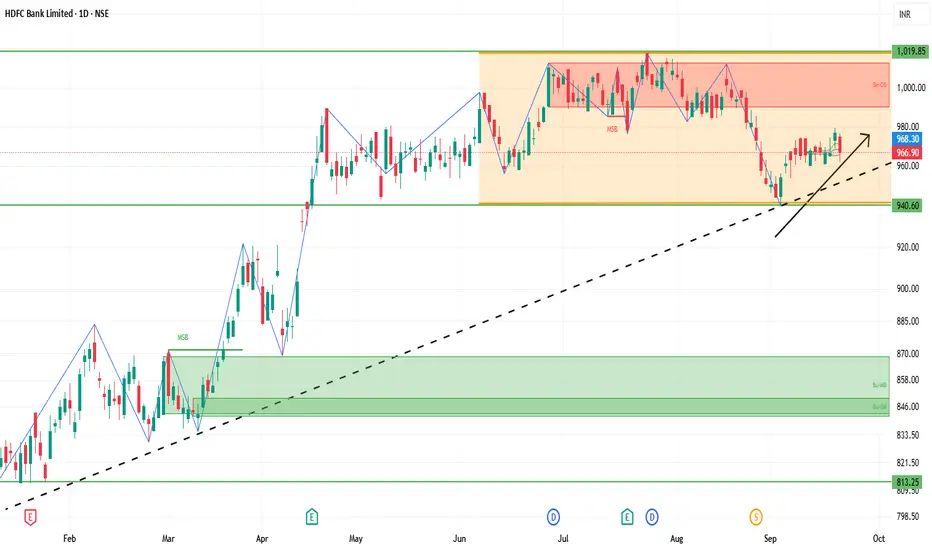
📊 Current Snapshot
Current Price: Around ₹967
Day Range: ₹962 – ₹976
52‑Week Range: High ~ ₹1,018, Low ~ ₹805
Volume: Slightly above recent average, showing decent trading interest
🔍 Support & Resistance
Immediate Resistance: ₹975 – ₹983
Higher Resistance: ₹989 – ₹990
Immediate Support: ₹960 – ₹954
Lower Support: ₹946
⚙️ Indicators & Trend
RSI / Stochastic: Neutral to slightly bearish, indicating mild selling pressure
Pivot Level: Around ₹968 – ₹969, meaning price is near equilibrium
Moving Averages: Mixed signals; short-term MAs under slight pressure, long-term trend still intact
🎯 Possible Scenarios
Bullish Case: Break and sustain above ₹980 → next target ₹990+
Bearish Case: Fail at resistance → pullback toward ₹960‑₹954; below ₹954 → possible drop to ₹946
⚠️ Key Points
Resistance zones are tight and need strong volume for a breakout
Price near pivot levels may lead to short-term sideways movement or volatility
Confirmation from trading volume is important for trend sustainability
Powiązane publikacje
Wyłączenie odpowiedzialności
Informacje i publikacje przygotowane przez TradingView lub jego użytkowników, prezentowane na tej stronie, nie stanowią rekomendacji ani porad handlowych, inwestycyjnych i finansowych i nie powinny być w ten sposób traktowane ani wykorzystywane. Więcej informacji na ten temat znajdziesz w naszym Regulaminie.