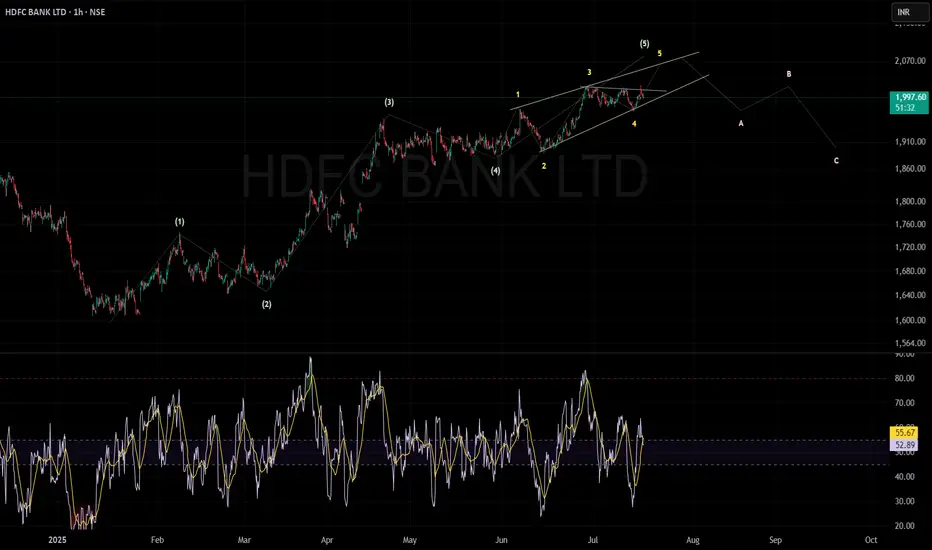
HDFC Bank is currently in the last (5th) wave of an uptrend. This wave is moving inside a narrow, rising wedge pattern called an ending diagonal.
The price can move higher towards ₹2,050–₹2,100 before the trend finishes.
If the price breaks below the bottom of the wedge pattern (ending diagonal), it could confirm a trend reversal, likely leading to a correction.
After the peak, the chart suggests a three-step drop (A, B, and C waves), with possible support around ₹1,910 and then ₹1,850.
The RSI (Relative Strength Index) is around 53, meaning the trend isn't overbought or oversold yet.
In short: The uptrend is close to ending. Watch for a break below the wedge—this could start a move down toward ₹1,910 first, then maybe ₹1,850.
Wyłączenie odpowiedzialności
Informacje i publikacje nie stanowią i nie powinny być traktowane jako porady finansowe, inwestycyjne, tradingowe ani jakiekolwiek inne rekomendacje dostarczane lub zatwierdzone przez TradingView. Więcej informacji znajduje się w Warunkach użytkowania.
Wyłączenie odpowiedzialności
Informacje i publikacje nie stanowią i nie powinny być traktowane jako porady finansowe, inwestycyjne, tradingowe ani jakiekolwiek inne rekomendacje dostarczane lub zatwierdzone przez TradingView. Więcej informacji znajduje się w Warunkach użytkowania.