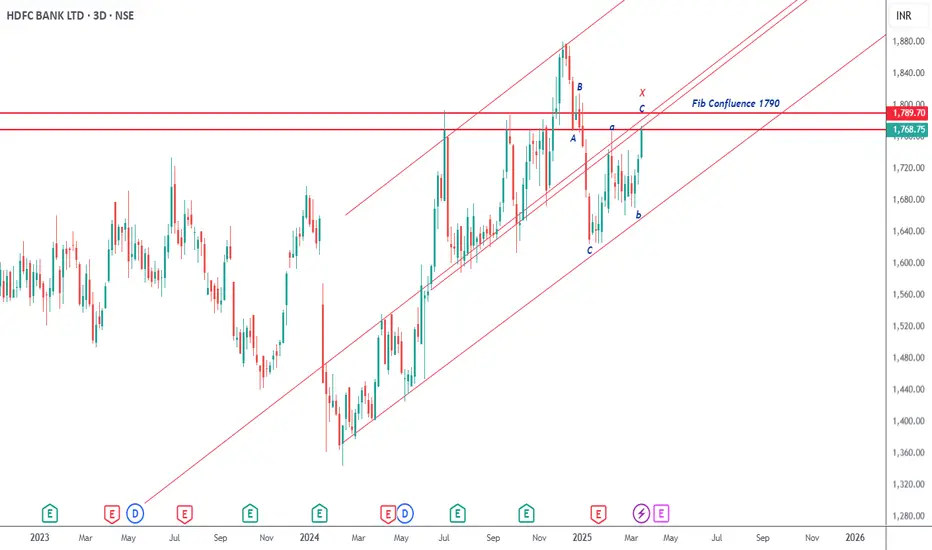
HDFC Bank CMP 1769
I had posted previously how this stock has turned negative on higher time frame charts. Now it is set on the daily charts as well.
Elliott- The first correction from the highs is a bullish zig zag. It is followed by another corrective pattern which is a bearish zig zag. Hence a fresh three wave fall ABC should begin from here.
Fibs- the current zone and the next at 1769 are both fib confluence zones and hence strong resistance.
Channel - the stock is also at channel resistance as well.
Conclusion - In my view it will break the 1600 zone this time around.
Wyłączenie odpowiedzialności
Informacje i publikacje przygotowane przez TradingView lub jego użytkowników, prezentowane na tej stronie, nie stanowią rekomendacji ani porad handlowych, inwestycyjnych i finansowych i nie powinny być w ten sposób traktowane ani wykorzystywane. Więcej informacji na ten temat znajdziesz w naszym Regulaminie.