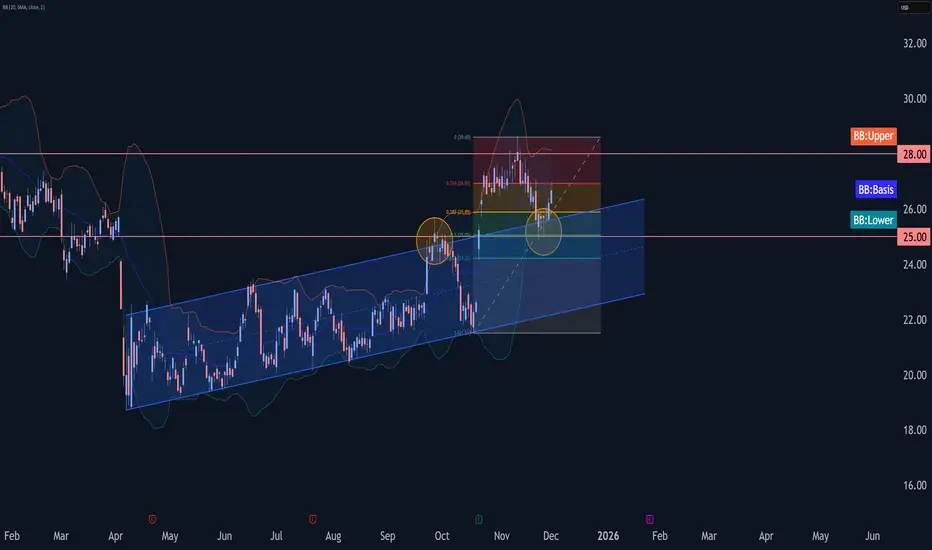
- Halliburton reversed from support zone
- Likely to rise to resistance level 28.00
Halliburton recently reversed from the support zone between the support level 25.00 (former resistance from September), lower daily Bollinger Band and the 50% Fibonacci correction of the upward impulse from October.
The upward reversal from this support zone started the active short-term impulse wave 5.
Given the clear daily uptrend, Halliburton can be expected to rise to the next resistance level 28.00 (which stopped the previous wave b).
By the FxPro Analyst Team
Follow our dedicated Telegram channel t.me/fxpro for insightful market analysis and expert commentary.
Reach out to media.comments@fxpro.com for PR and media inquiries
Follow our dedicated Telegram channel t.me/fxpro for insightful market analysis and expert commentary.
Reach out to media.comments@fxpro.com for PR and media inquiries
Wyłączenie odpowiedzialności
Informacje i publikacje nie stanowią i nie powinny być traktowane jako porady finansowe, inwestycyjne, tradingowe ani jakiekolwiek inne rekomendacje dostarczane lub zatwierdzone przez TradingView. Więcej informacji znajduje się w Warunkach użytkowania.