DLF Limited – Weekly Chart Analysis (Technical View)
Company Background:
Founded in 1946, DLF Limited is India’s largest real estate developer, renowned for its premium residential and commercial projects.
With iconic developments and vast land holdings across Delhi-NCR, Mumbai, and Bengaluru, DLF is a dominant player in high-end real estate.
Core Business Segments
Commercial Properties: IT Parks, retail malls (e.g., DLF CyberHub, DLF Emporio), Grade-A offices.
Residential: Luxurious apartments, gated communities in prime locations.
Land Bank: Extensive holdings in urban growth centers.
Leasing & Rentals: Strong recurring income from office and retail leasing.
This analysis is based on the weekly time frame, offering a medium- to long-term outlook for positional and swing traders.
Chart Structure Overview:
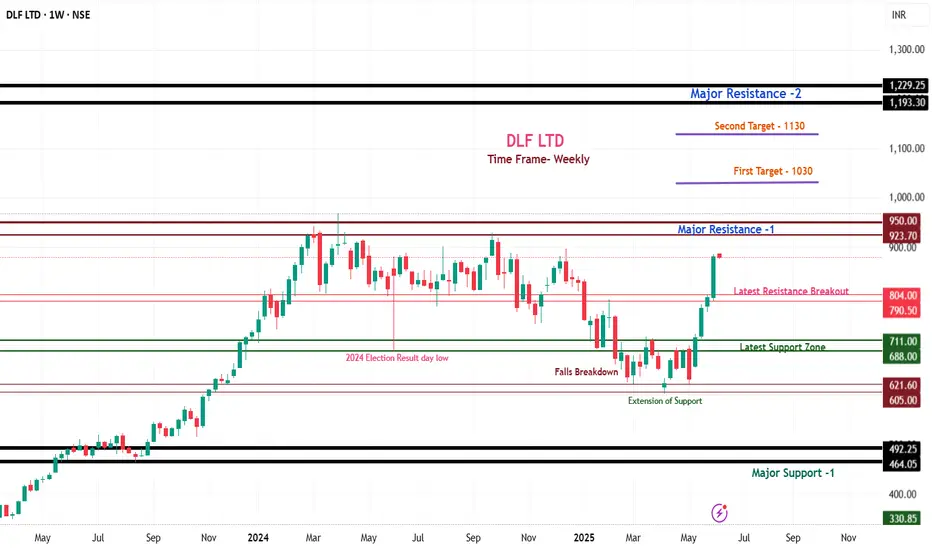
1. DLF is currently trading around ₹878 and has shown a strong recovery after retesting its breakout zone of ₹804–₹790. The structure indicates bullish momentum.
2. But a major resistance zone lies between ₹923 and ₹950. Price action near this zone will be crucial in determining the next directional move.
Bullish Scenario – If ₹950 Breaks with Volume:
The zone of ₹923 to ₹950 is a major hurdle, acting as a resistance ceiling.
A weekly close & sustain above ₹950 will confirm a strong breakout.
After that:
First Target: ₹1,030
Second Target: ₹1,130 to ₹1,180
🔽 Bearish Scenario – If Price Fails Near ₹950
The immediate support zone lies at ₹804–₹790, which earlier acted as resistance.
If the price fails to hold this level:
Next support seen at ₹711 to ₹688
A breakdown below ₹688 could lead to a deeper fall towards ₹605 to ₹621
If ₹605 breaks decisively, further downside could extend toward ₹492–₹464, which is a **major long-term support on the chart
Conclusion:
1. This is a weekly chart-based analysis, ideal for swing or positional trades. The ₹950 level is the key breakout zone for the next bull leg.
2. As long as the price remains above ₹804, the structure remains positive.
Below ₹688, trend may weaken significantly.
💬 Found this chart breakdown helpful?
👍 Like | 💭 Comment | ➕ Follow for more weekly chart analysis and breakout setups!
Published on TradingView – DLF Limited | Weekly Analysis
Company Background:
Founded in 1946, DLF Limited is India’s largest real estate developer, renowned for its premium residential and commercial projects.
With iconic developments and vast land holdings across Delhi-NCR, Mumbai, and Bengaluru, DLF is a dominant player in high-end real estate.
Core Business Segments
Commercial Properties: IT Parks, retail malls (e.g., DLF CyberHub, DLF Emporio), Grade-A offices.
Residential: Luxurious apartments, gated communities in prime locations.
Land Bank: Extensive holdings in urban growth centers.
Leasing & Rentals: Strong recurring income from office and retail leasing.
This analysis is based on the weekly time frame, offering a medium- to long-term outlook for positional and swing traders.
Chart Structure Overview:
1. DLF is currently trading around ₹878 and has shown a strong recovery after retesting its breakout zone of ₹804–₹790. The structure indicates bullish momentum.
2. But a major resistance zone lies between ₹923 and ₹950. Price action near this zone will be crucial in determining the next directional move.
Bullish Scenario – If ₹950 Breaks with Volume:
The zone of ₹923 to ₹950 is a major hurdle, acting as a resistance ceiling.
A weekly close & sustain above ₹950 will confirm a strong breakout.
After that:
First Target: ₹1,030
Second Target: ₹1,130 to ₹1,180
🔽 Bearish Scenario – If Price Fails Near ₹950
The immediate support zone lies at ₹804–₹790, which earlier acted as resistance.
If the price fails to hold this level:
Next support seen at ₹711 to ₹688
A breakdown below ₹688 could lead to a deeper fall towards ₹605 to ₹621
If ₹605 breaks decisively, further downside could extend toward ₹492–₹464, which is a **major long-term support on the chart
Conclusion:
1. This is a weekly chart-based analysis, ideal for swing or positional trades. The ₹950 level is the key breakout zone for the next bull leg.
2. As long as the price remains above ₹804, the structure remains positive.
Below ₹688, trend may weaken significantly.
💬 Found this chart breakdown helpful?
👍 Like | 💭 Comment | ➕ Follow for more weekly chart analysis and breakout setups!
Published on TradingView – DLF Limited | Weekly Analysis
Wyłączenie odpowiedzialności
Informacje i publikacje przygotowane przez TradingView lub jego użytkowników, prezentowane na tej stronie, nie stanowią rekomendacji ani porad handlowych, inwestycyjnych i finansowych i nie powinny być w ten sposób traktowane ani wykorzystywane. Więcej informacji na ten temat znajdziesz w naszym Regulaminie.