Wave Structure Overview – Elliott Cycle Breakdown
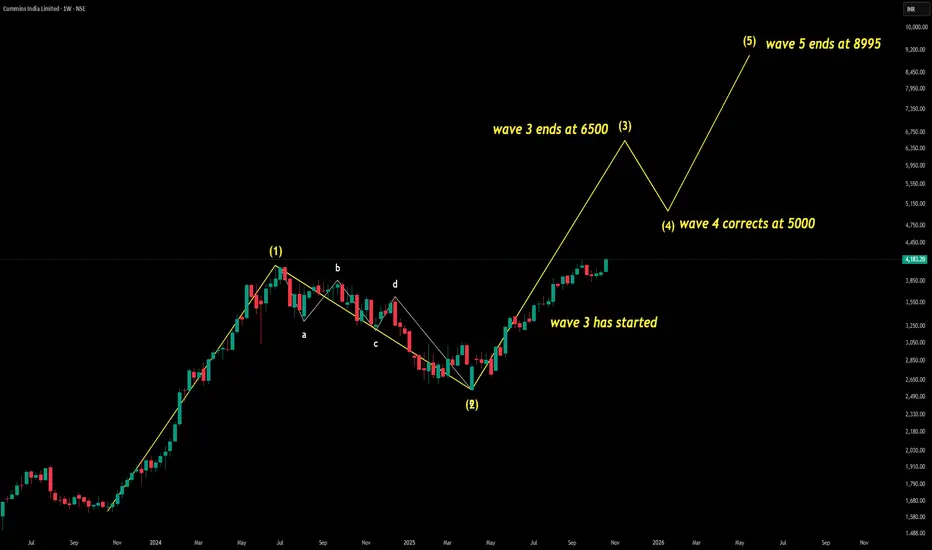
This chart captures a full Elliott Wave impulse cycle (1–5) followed by the anticipated corrective phase (a–b–c). It reflects market psychology in motion—from early optimism to trend exhaustion.
Wave Summary:
Wave (1): Initial breakout – trend confirmation begins
Wave (2): Shallow pullback – bullish continuation
Wave (3): Ends at 6500 – strongest wave, broad participation
Wave (4): Corrects to 5000 – healthy retracement, sets up final push
Wave (5): Ends at 8995 – final rally, possible exhaustion or divergence
Wave a–b–c: Expected next – corrective structure likely
Technical Insights
Wave 3 shows classic acceleration – ideal for breakout teaching
Wave 4 respects Fibonacci zones – great for entry logic
Wave 5 overshoots – likely divergence, ideal for reversal training
Strategic Takeaways – For Traders & Students
Impulse cycle (1–5) is complete
Wave 5 has peaked at 8995 – trend exhaustion likely
What’s Next Prepare for a–b–c corrective structure
Watch for: RSI divergence
Volume drop
Fibonacci retracement zones (38.2%–61.8%)
“Wave 5 has completed at 8995. Expect a corrective a–b–c structure. Avoid fresh longs. Ideal time to teach reversal setups, divergence spotting, and Fibonacci retracement logic.”
Sucrit.D.Patil
Wyłączenie odpowiedzialności
Informacje i publikacje nie stanowią i nie powinny być traktowane jako porady finansowe, inwestycyjne, tradingowe ani jakiekolwiek inne rekomendacje dostarczane lub zatwierdzone przez TradingView. Więcej informacji znajduje się w Warunkach użytkowania.
Sucrit.D.Patil
Wyłączenie odpowiedzialności
Informacje i publikacje nie stanowią i nie powinny być traktowane jako porady finansowe, inwestycyjne, tradingowe ani jakiekolwiek inne rekomendacje dostarczane lub zatwierdzone przez TradingView. Więcej informacji znajduje się w Warunkach użytkowania.