Zaktualizowano
Falling Wedge breakout.
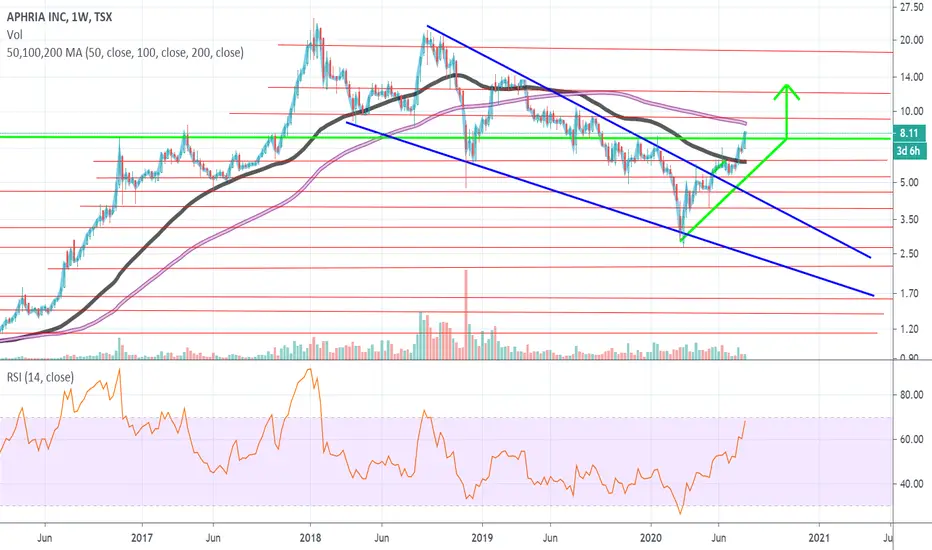
APHA has broken the downward sloping resistance of the Falling Wedge pattern outlined in blue flush to the upside, and upon back testing the area of resistance it's now turned into support.
Notice the higher high creation for the first time since 2018 ATH's?
The Green pattern in this chart is an Ascending Triangle, and upon break out of this pattern APHA has created a Macro higher high.
Any pull back in APHA would need to hold either the top of the ascending triangle upon a back test, or the upward sloping green line of support if there's to be continued bullish price action.
Uwaga
Bullish Flag on a log scale one day & 5-day chart.
Wyłączenie odpowiedzialności
Informacje i publikacje przygotowane przez TradingView lub jego użytkowników, prezentowane na tej stronie, nie stanowią rekomendacji ani porad handlowych, inwestycyjnych i finansowych i nie powinny być w ten sposób traktowane ani wykorzystywane. Więcej informacji na ten temat znajdziesz w naszym Regulaminie.