Zaawansowany tryb widoku listy obserwacyjnej
Listy obserwacyjne mogą pokazywać znacznie więcej niż tylko dane o cenach i ich zmianach. Uzyskując dostęp do zaawansowanego trybu widoku, możesz głębiej analizować wybrane symbole.
ZAWARTOŚĆ:
Jak uzyskać dostęp do zaawansowanego trybu widoku
Z dowolnej strony TradingView, po otwarciu listy obserwacyjnej, kliknij ikonę wykresu kołowego w prawym górnym rogu.

Karty widoku zaawansowanego
Dzięki kartom możesz zamienić swoją listę obserwacyjną w narzędzie do screeningu. Dane są uporządkowane w kilku sekcjach, z których każda zapewnia przegląd różnych aspektów Twoich symboli.
Przegląd
W tej sekcji znajdziesz różne przydatne metryki dotyczące Twojej listy obserwacyjnej. Tabela ma kilka trybów:
- Cena: Kluczowe dane obejmujące wartości cen, zmiany cen, wolumen obrotu i kapitalizację rynkową
- Wskaźniki finansowe: Dane fundamentalne, takie jak przychody, zysk na akcję (EPS), wskaźnik cena/zysk (P/E), beta, dywidenda i rentowność
- Wydajność: Zmiana ceny w procentach w różnych okresach
- Ryzyko: Wskaźniki beta i zmienności w różnych przedziałach czasowych
- Techniczne: Kluczowe wskaźniki techniczne i oceny

Cena
W tej zakładce znajdziesz najważniejsze dane dotyczące ceny instrumentu i jej zmian:
- Ostatnia cena: Aktualna cena instrumentu w jego walucie
- Zmiana procentowa: Różnica procentowa między bieżącą a poprzednią ceną zamknięcia
- Zmiana: Różnica w wartościach między bieżącą a poprzednią ceną zamknięcia
- Wolumen: Liczba jednostek instrumentu handlowanych w ciągu dnia
- Średni wolumen (10): Średni wolumen obrotu z ostatnich 10 dni
- Kapitalizacja rynkowa: Całkowita wartość rynkowa spółki
Financials
Tutaj znajdziesz kluczowe dane z raportów finansowych:
- Przychody: Kwota, jaką spółka uzyskała ze sprzedaży towarów lub usług w danym okresie
- EPS: Zysk przypadający na jedną akcję zwykłą
- Wskaźnik ceny do zysku : Relacja ceny akcji do zysku na akcję
- Beta: Miara wrażliwości instrumentu na zmiany całego rynku
- Dywidenda: Wypłata gotówkowa przekazywana akcjonariuszom
- Rentowność dywidendy:Stosunek rocznej dywidendy do ceny akcji
Wydajność
Ta sekcja pokazuje zmianę ceny w procentach w różnych przedziałach czasowych:
- Jeden tydzień
- Jeden miesiąc
- Trzy miesiące
- Od początku roku
- Jeden rok
- Pięć lat
- Cały okres
Ryzyko
- Beta 1L / 3L / 5L: Mierzy wrażliwość aktywa na ruchy rynkowe
- Zmienność 1D / 1T / 1M: Pokazuje wahania ceny instrumentu w określonym czasie
Techniczne
Techniczne
- Ocena techniczna: Łączna ocena oparta na kilku wskaźnikach technicznych
- Średnie kroczące – Sugestia oparta na średnich kroczących
- Ocena oscylatorów: Sugestia oparta na oscylatorach
- RSI (14): Wskaźnik momentum pokazujący potencjalne poziomy wykupienia lub wyprzedania
- Momentum (10): Oscylator momentum używany do określania trendów rynkowych
- AO: Awesome Oscillator — mierzy momentum rynku
- CCI (20): Oscylator identyfikujący poziomy wykupienia i wyprzedania poprzez pomiar odchyleń od średniej statystycznej
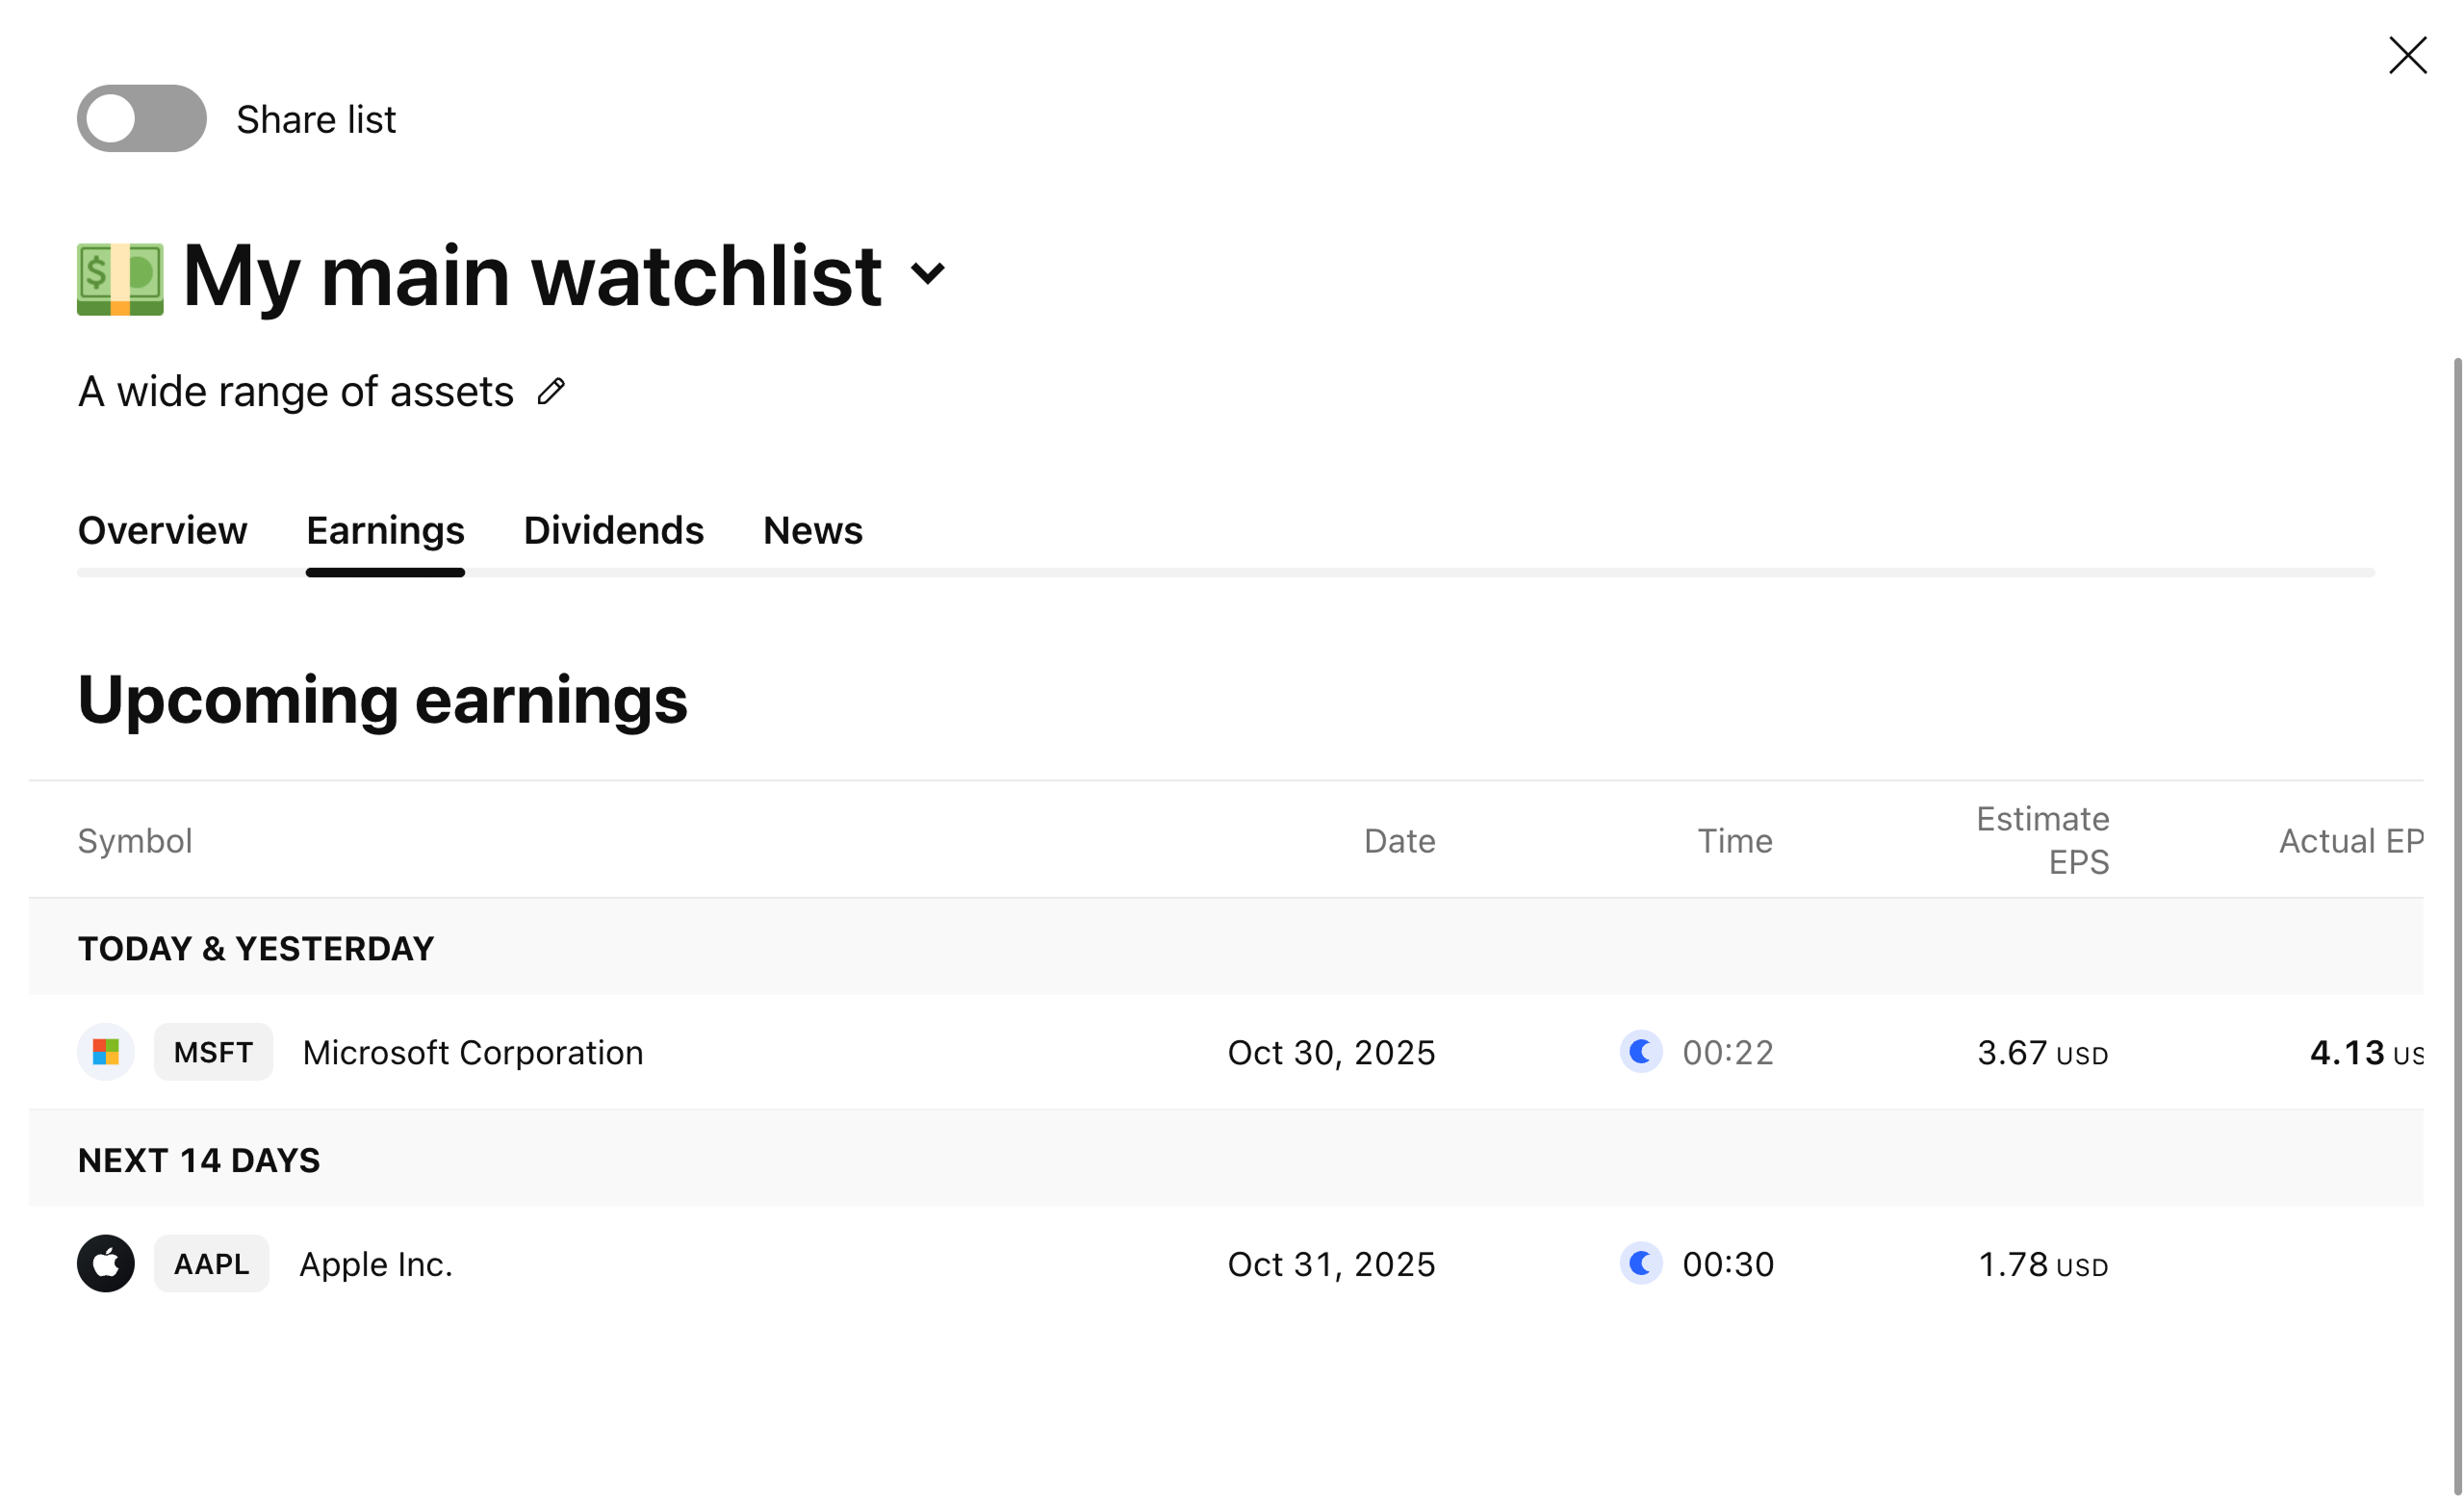
Wyniki finansowe
Ta sekcja wyświetla nadchodzące raporty wyników. Zawiera następujące pola:
- Data: Data publikacji raportu wyników
- Czas: Szacowany lub rzeczywisty czas publikacji raportu
- Szacowany EPS: Prognozowany zysk na akcję
- Rzeczywisty EPS: Rzeczywisty zysk na akcję (jeśli został już opublikowany)
- Niespodzianka: Różnica między rzeczywistym a prognozowanym zyskiem, w %
- Kapitalizacja rynkowa: Wartość rynkowa spółki
Dywidendy
Ta sekcja wyświetla kalendarz dywidend na najbliższe 14 dni.
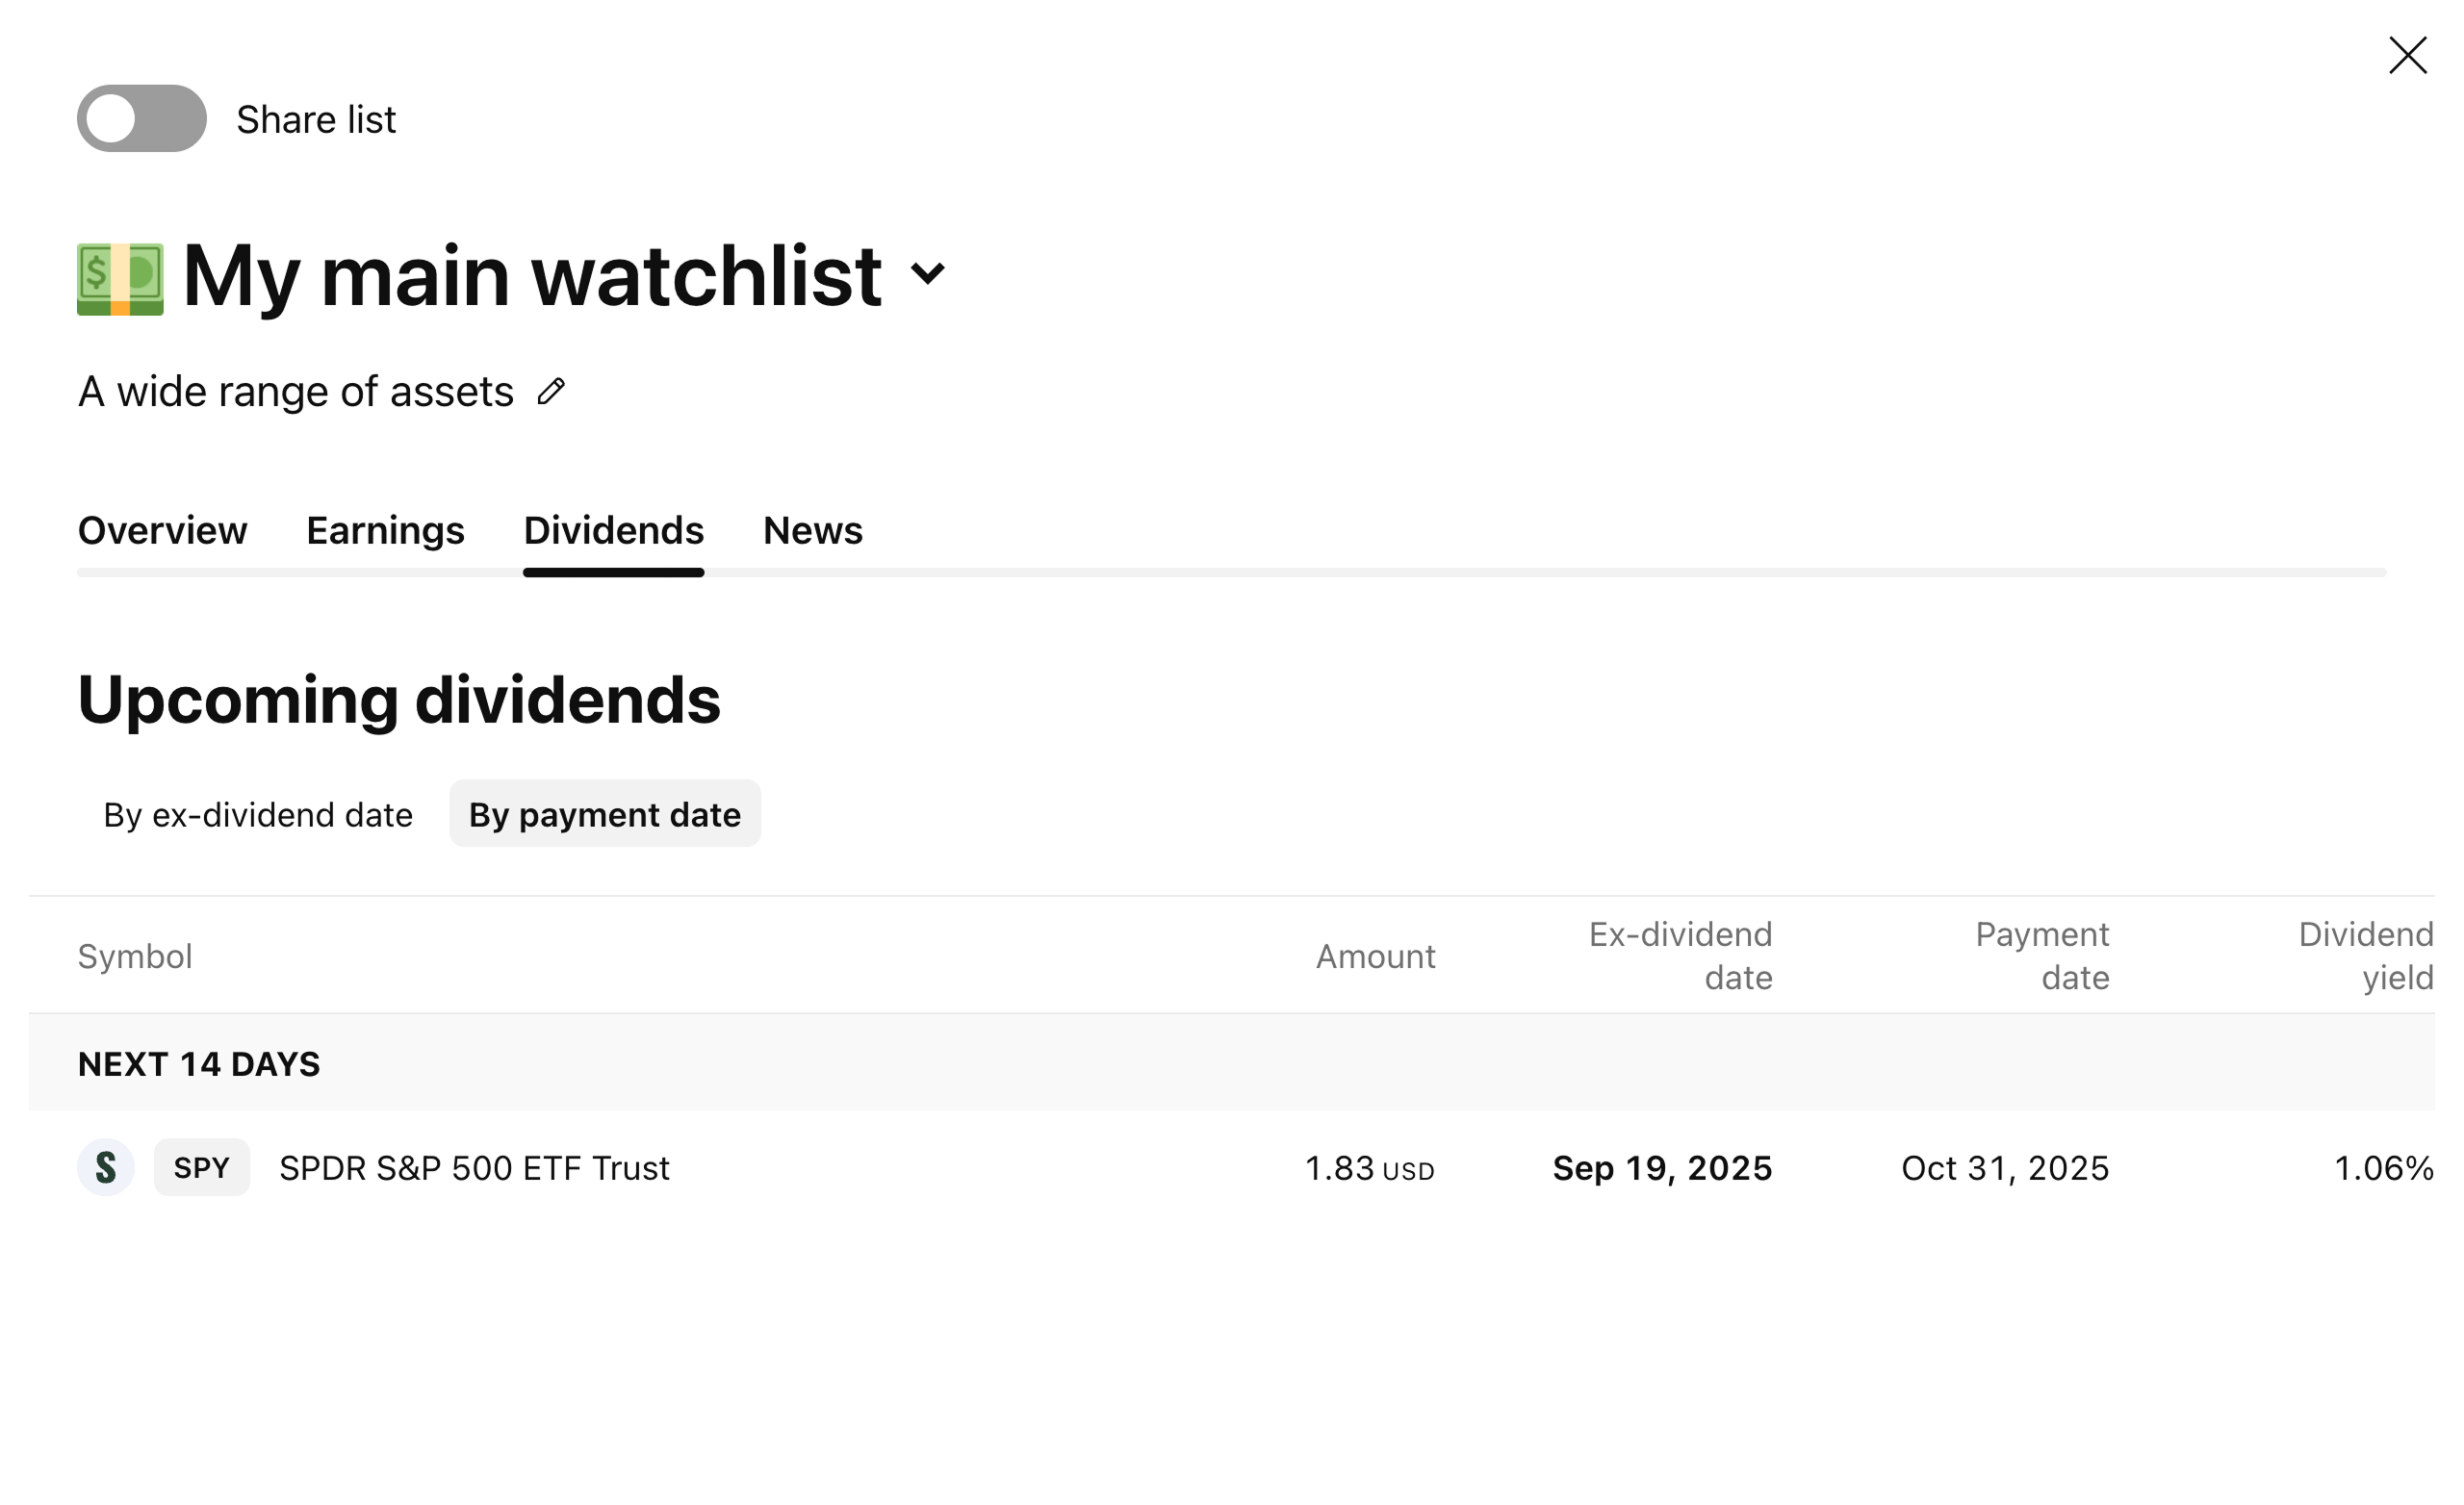
Tabela może zostać wygenerowana według:
- Data odcięcia dywidendy (Ex-dividend date): Ostatni dzień, w którym akcjonariusze mają prawo do otrzymania najnowszej dywidendy
- Data wypłaty (Payment date): Data, w której spółka faktycznie wypłaca zadeklarowaną dywidendę akcjonariuszom
Tabela zawiera następujące pola:
- Kwota (Amount): Wysokość kwoty, którą spółka ma wypłacić
- Data odcięcia dywidendy (Ex-dividend date): Data graniczna, do której należy posiadać akcje, aby otrzymać dywidendę
- Data wypłaty (Payment date): Data, w której spółka ma wypłacić dywidendę
- Stopa dywidendy (Dividend yield): Dywidenda wyrażona jako procent ceny akcji
- Data wypłaty (Payment date): Data, w której spółka ma wypłacić dywidendę
- Stopa dywidendy (Dividend yield): Dywidenda wyrażona jako procent ceny akcji
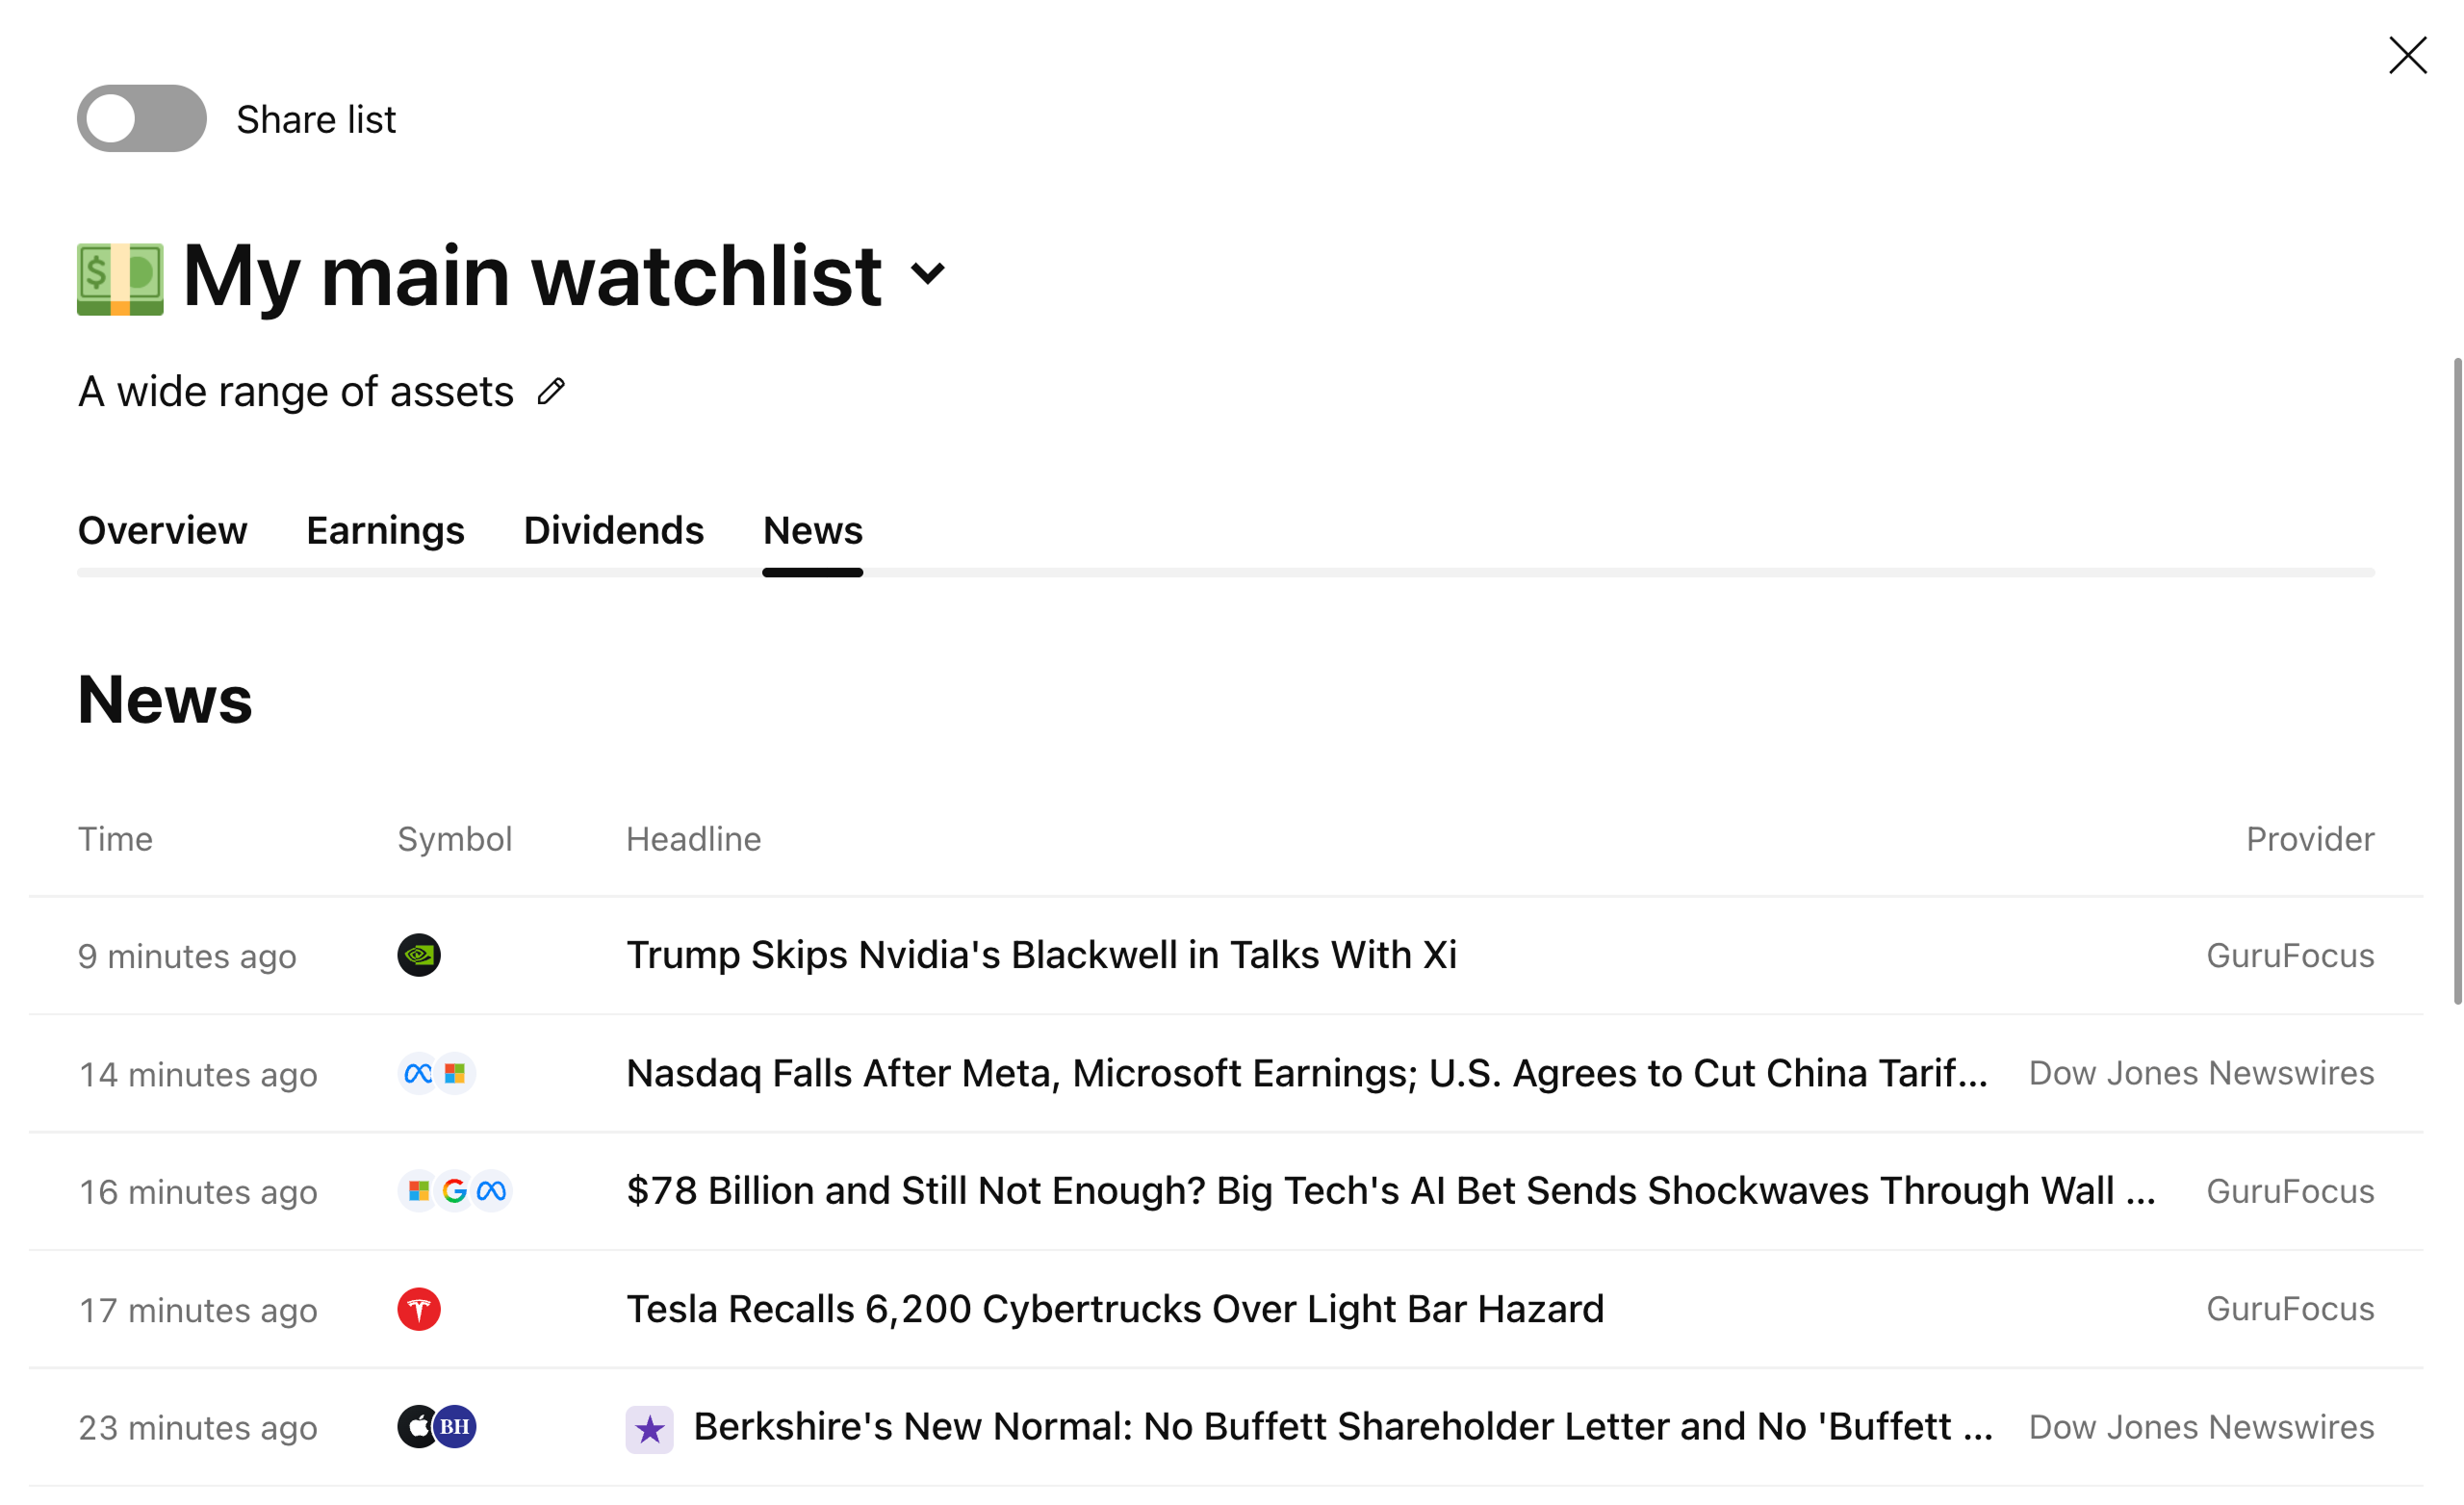
Wiadomości
W tej sekcji można znaleźć wszystkie najnowsze wiadomości dotyczące symboli z listy obserwacyjnej.
Dodatkowe opcje
W prawym górnym rogu tabeli znajdują się elementy sterujące oferujące dodatkowe opcje interakcji.
Konwersja waluty na USD
Jeśli lista obserwacyjna zawiera symbole notowane w walutach innych niż USD, można je łatwo przeliczyć.
Eksport listy
Kliknij ten przycisk, aby wyeksportować plik .txt zawierający nazwy sekcji listy obserwacyjnej i tickerów.
Podsumowanie
Dodaje wiersz podsumowania „RAZEM”, który wyświetla wartości zagregowane dla wszystkich symboli:
- Minimum
- Maksimum
- Średnia
- Mediana
! Uwaga: Podsumowanie działa na wartościach bezwzględnych i nie uwzględnia konwersji walut, wartości procentowych itp.
Grupuj według
Tutaj można uporządkować listę obserwacyjną według następujących kryteriów:
- Brak grupy
- Niestandardowe sekcje
- Waluta
- Typ symbolu
- Sektor
- Giełda
I jeszcze jedna zaawansowana opcja widoku…
Pod tabelą znajduje się widżet wizualizujący rozkład symboli. Dwa wykresy kołowe pokazują skład listy obserwacyjnej według typu symbolu i sektora.

Przeczytaj również: