Omówienie wykresów SVP (Session Volume Profile)
SPIS TREŚCI
- Czym są wykresy SVP
- Dlaczego warto korzystać z wykresu SVP
- Włączanie typu wykresu
- Ustawienia
- SVP w skrócie
Czym są wykresy SVP
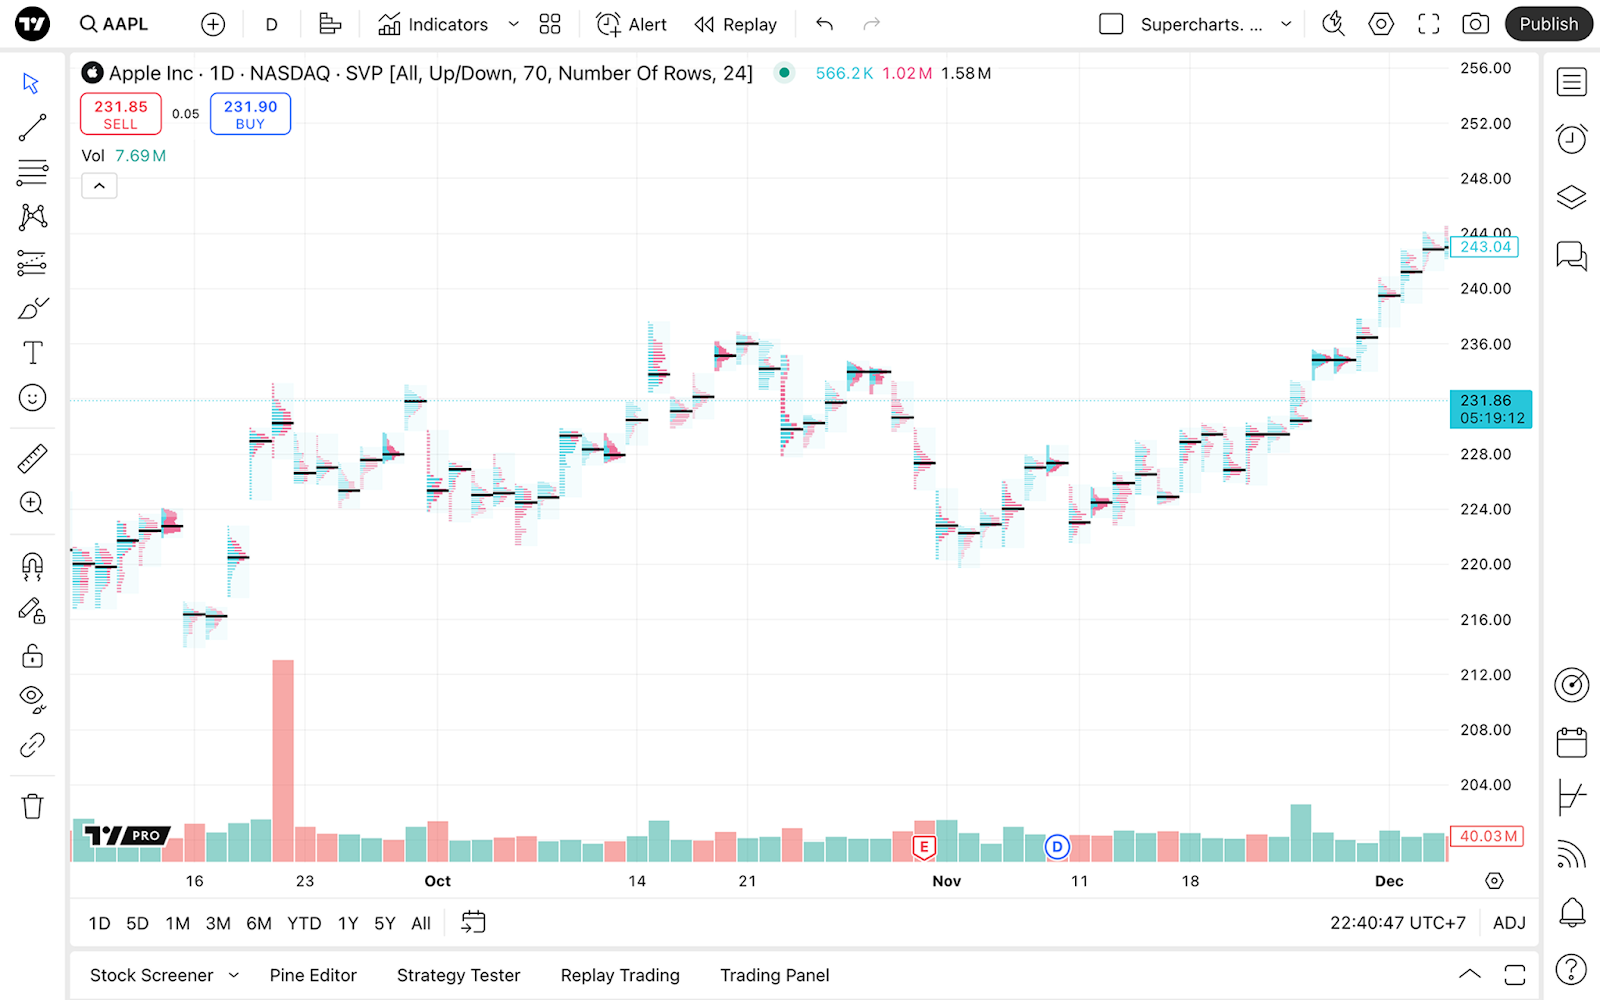
Session volume profile (SVP) chart shows volume histograms for the specified sessions, sub-sessions, or time intervals set in the settings. It calculates volume data, allowing traders to analyze the intraday volume activity of one specific part of the session.
Dlaczego wykres SVP
W przeciwieństwie do tradycyjnych świec lub słupków, typ wykresu Session Volume Profile pokazuje rynki z innej perspektywy: wizualizuje każdą sesję handlową jako pionowy profil wolumenu, co ułatwia zobaczenie, gdzie aktywność handlowa była największa. Dzięki temu wykres pokazuje, jak wolumen był rozłożony na różnych poziomach cenowych podczas danej sesji.
Wielu traderów wybiera ten typ wykresu, ponieważ może on uprościć analizę poprzez usunięcie zbędnych elementów wizualnych. Zamiast nakładać wiele wskaźników na świece, możesz skupić się na tym, gdzie rynek był w równowadze lub nierównowadze. Jest to szczególnie przydatne dla traderów, których strategie opierają się na wolumenie, ponieważ pozwala śledzić, jak wartość zmienia się w czasie oraz jak zmienia się sentyment rynkowy z sesji na sesję.
Poza ogólną ideą, wykres SVP może podpowiadać dynamikę wolumenu za pomocą swoich kształtów. Na przykład profil w kształcie litery D może sugerować zrównoważoną sesję, podczas gdy profil w kształcie litery P lub B może wskazywać na rozwój trendu.
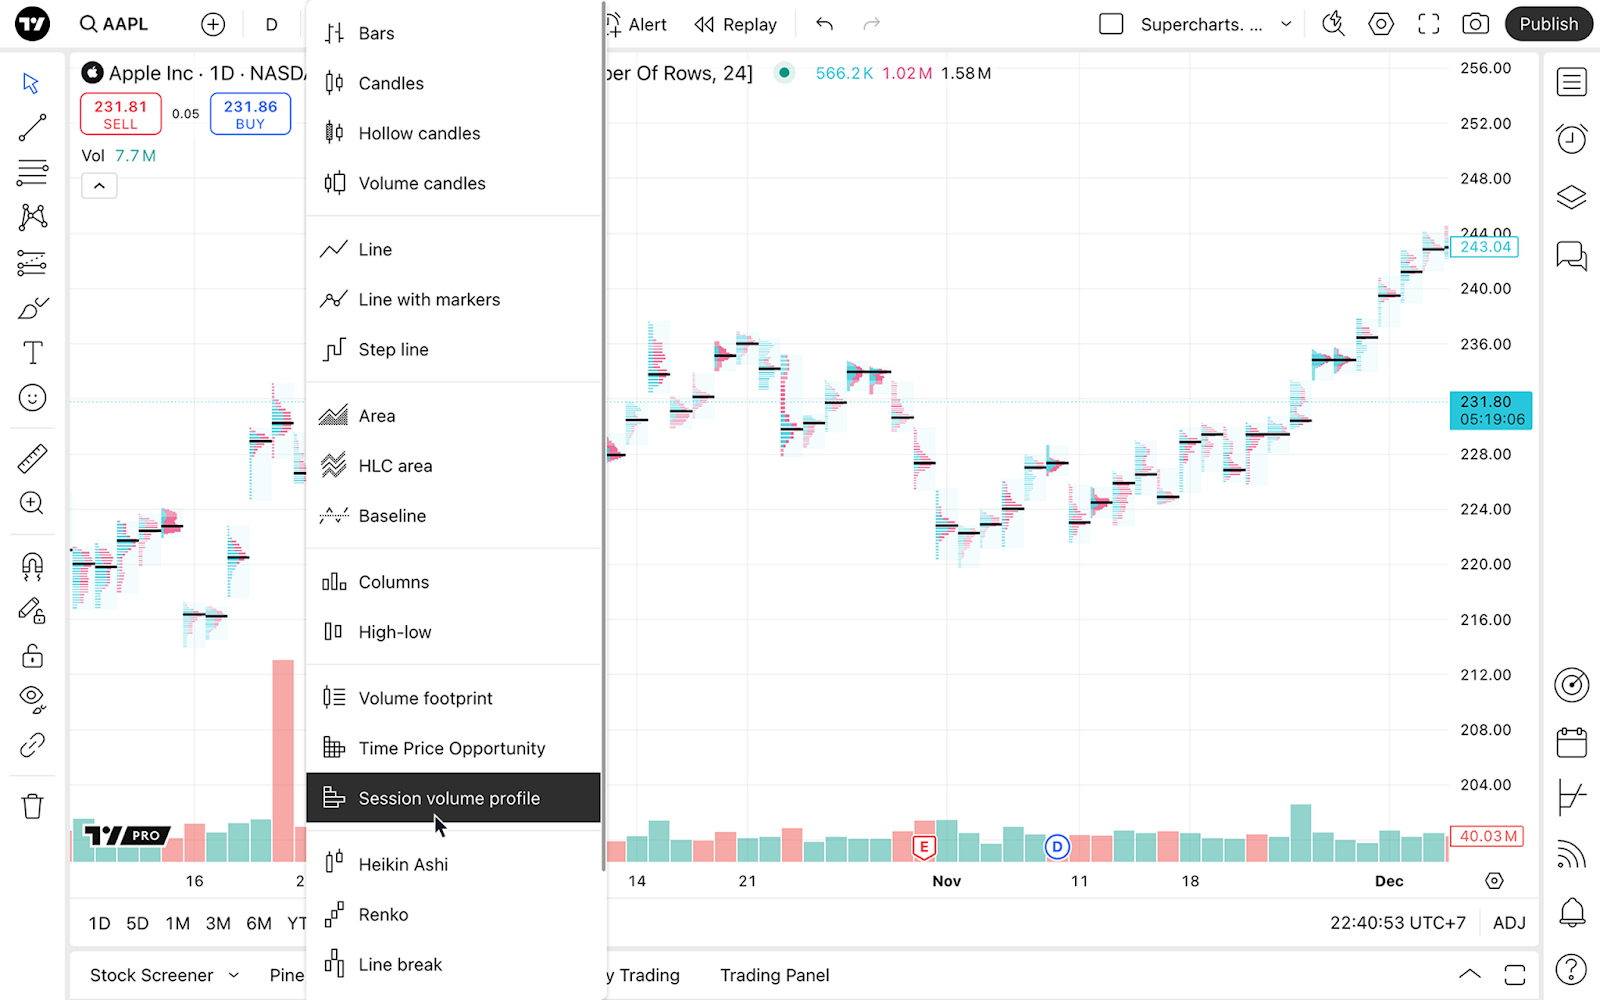
Włączanie typu wykresu
Gdy jesteś w Superwykresach, otwórz menu typu wykresu na górnym pasku narzędzi i wybierz „Session Volume Profile”.
Ustawienia
Aby dostosować wykres profilu wolumenu sesji, wybierz „Ustawienia” na górnym pasku narzędzi i przejdź do zakładki „Symbol”.
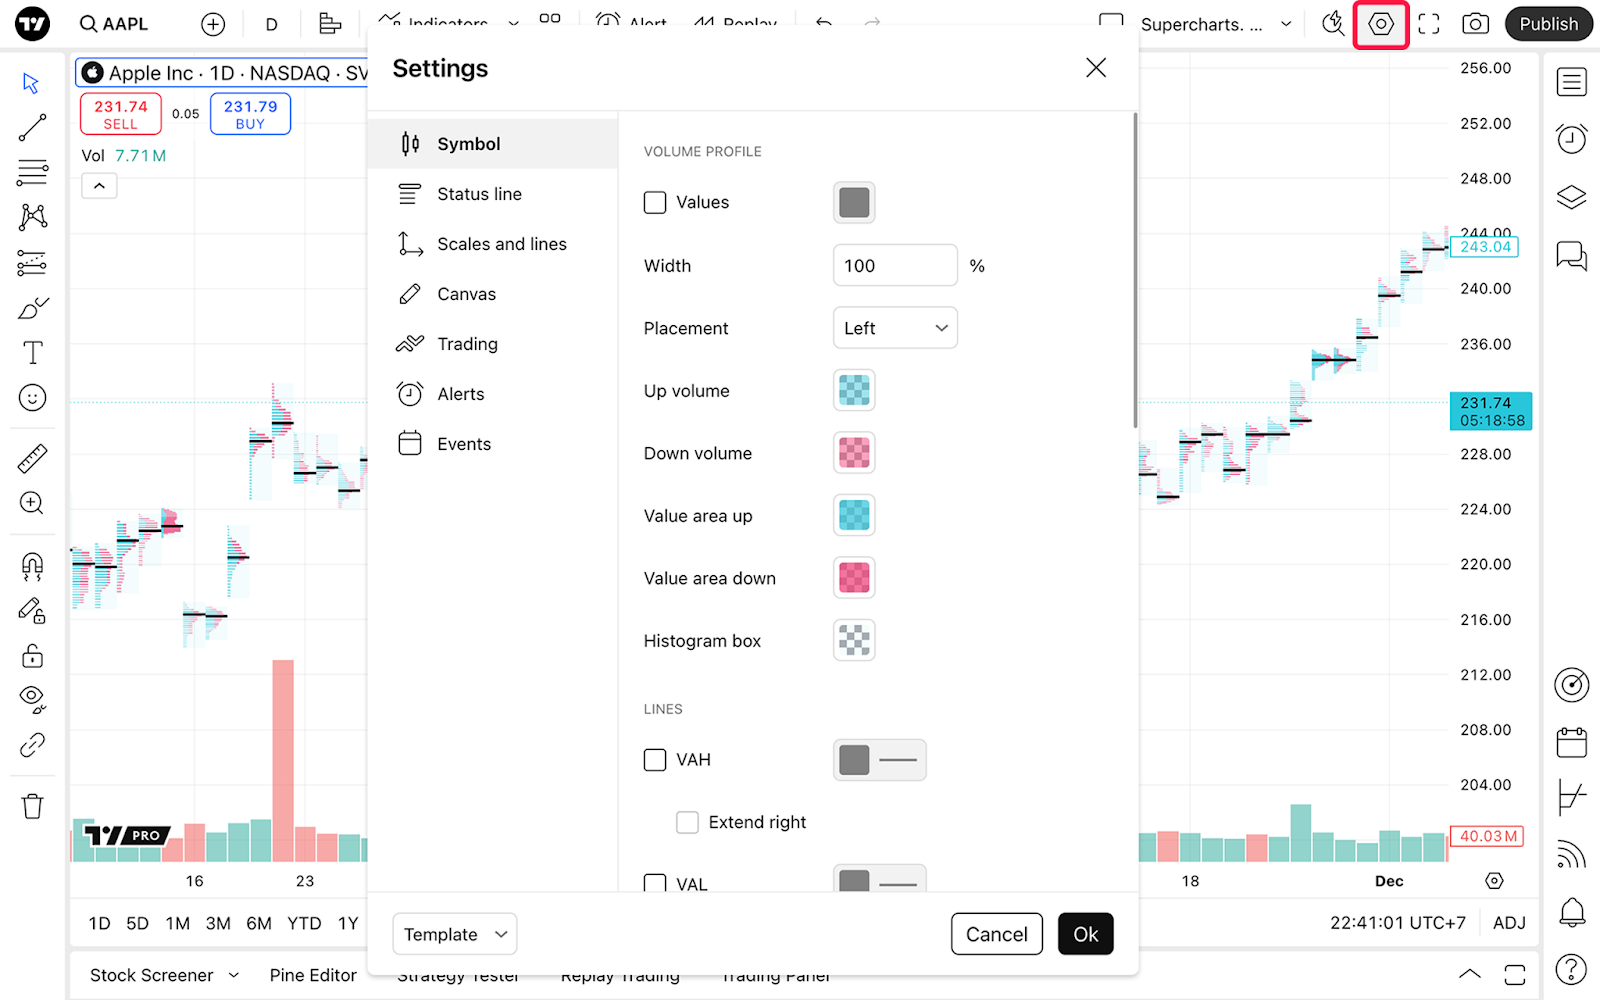
Profil wolumenu
W sekcji „Profil wolumenu” możesz włączyć wyświetlanie wartości na kolumnach histogramu, dostosować szerokość kolumn oraz kolory histogramu.
- Wartości: Przełącz widoczność i ustaw kolor wartości widocznych po lewej stronie wykresu
- Szerokość: Zmień szerokość kolumn w histogramie
- Położenie: Przenieś słupki na lewą lub prawą stronę obszaru sesji handlowej
- Wolumen wzrostowy: Ustal kolor i przezroczystość wolumenu wzrostowego (kupna)
- Wolumen spadkowy: Ustal kolor i przezroczystość wolumenu spadkowego (sprzedaży)
- Obszar wartości – wzrost: Ustal kolor i przezroczystość obszaru wartości dla wzrostów
- Obszar wartości – spadek: Ustal kolor i przezroczystość obszaru wartości dla spadków
- Pole histogramu: Ustal kolor tła i przezroczystość obszaru profilu wolumenu
Linie
W sekcji „Linie” możesz włączyć linie takie jak POC (Point of Control), VAH (Value Area High), VAL (Value Area Low), rozwijający się POC i rozwijający się VA.
- VAH: Przełącz widoczność
- Rozszerz VAH w prawo: Rozciąga linię, aż przetnie dowolny słupek
- VAL: Przełącz widoczność
- Rozszerz VAL w prawo: Rozciąga linię, aż przetnie dowolny słupek
- POC: Przełącz widoczność
- Rozszerz POC w prawo: Rozciąga linię, aż przetnie dowolny słupek
- Rozwijający się POC: Przełącz widoczność, pokazując jak zmieniał się POC, gdy rynek był w trakcie sesji
- Rozwijający się VA: Przełącz widoczność, pokazując jak zmieniał się VA, gdy rynek był w trakcie sesji
Wejścia
W sekcji „Wejścia” możesz ustawić sesję, w której będą wyświetlane wolumen, położenie linii i rozmiar poziomów.
- Sesje: Określa, w jaki sposób tworzony jest wykres profilu wolumenu sesji
- Wszystko: Wskaźnik uwzględni pre-market, główną sesję handlową i post-market jako jedną sesję. Jeden profil zostanie utworzony dla każdego dnia handlowego i obejmie wolumen wszystkich transakcji od pierwszej świecy pre-market do ostatniej świecy post-market
- Każda: Tworzy oddzielny profil wolumenu dla każdej części sesji handlowej, uwzględniając tylko transakcje z tego okresu. Jeśli symbol ma rozszerzone godziny (pre-market, główna sesja, post-market), wykres utworzy trzy oddzielne profile dla każdego dnia
- Tylko pre-market, tylko sesja główna, tylko post-market: W tych opcjach wykres utworzy jeden profil wolumenu na dzień, w oparciu o transakcje z określonego okresu
- Niestandardowe: Skonfiguruj początek i koniec okresu, dla którego profil ma być utworzony. Możesz też wybrać strefę czasową
- Wolumen: Przełącz między wyświetlaniem całkowitego wolumenu dla każdego wiersza (całkowity), podziałem na kupno/sprzedaż lub wyświetlaniem ich różnicy (delta)
- Wolumen obszaru wartości: Określ, jaki procent całego wolumenu sesji ma być wyróżniony jako obszar wartości
- Układ wierszy / rozmiar wiersza: Określ sposób, w jaki wykres oblicza liczbę wierszy w każdym histogramie
Możesz przeczytać więcej o tym, jak obliczane są wartości, w naszym artykule o wskaźniku Session Volume Profile.
SVP w skrócie
Wykres SVP wyświetla histogramy wolumenu dla konkretnych sesji handlowych, pokazując, gdzie miała miejsce największa aktywność na różnych poziomach cenowych. Wykres ujawnia, które ceny przyciągały największe zainteresowanie kupujących i sprzedających w trakcie sesji, wykorzystując poziome słupki.
SVP podkreśla kluczowe poziomy, takie jak Point of Control (POC) — cena o najwyższym wolumenie — oraz granice Value Area High/Low (VAH/VAL). Możesz analizować całe dni handlowe lub oddzielne sesje (pre-market, market, post-market), aby identyfikować strefy wsparcia/oporu i obszary akceptacji rynku na podstawie rzeczywistego rozkładu wolumenu.
Zobacz także: