Zig-Zag Volume Profile (Bull vs. Bear) [Kioseff Trading]Hello!
Thank you @Pinecoders and @TradingView for putting polylines in production and making this viable!!
This script "Zig Zag Volume Profile" implements the polyline feature for Pine Script!
Features
Volume Profile anchored to zig zag trends
Bull vs Bear profiles!
Delta x price level
Standard POC and value area lines, in addition to separated POCs and value area lines for bull profiles and bear profiles
Up to 9999 profile rows per zigzag trend
Stylistic options for profiles
Configurable zig zag - profiles generated for small to large trends
Polylines!
This script generates Bull vs. Bear volume profiles for zig zag trends!
The zigzag indicator is configurable as normal; minor and major trend volume profiles are calculable. This indicator can be thought of as "Volume Profile/Delta for Trends''.
Up to 9999 volume profile levels (price levels) can be calculated for each profile, thanks to the new polyline feature, allowing for less aggregation / more precision of volume at price and volume delta.
Zig Zag Bull Vs Bear Profiles
The image above shows primary functionality!
Green profiles = buying volume
Red profiles = selling volume
Profiles are generated for each trend identified by the zigzag indicator.
The image above shows the indicator calculating volume delta for specific price blocks on the profile. Aggregate volume delta for the identified trend is displayed over the profile!
The image above shows Bull Profile POC lines and value area lines. Bear Profile POC lines and value area lines are also shown!
All colors and transparencies are configurable to the user's liking :D
Additionally, you can select to have the profiles drawn on contrasting sides. Bull Profile on left and Bear Profile on right.
For a more traditional look - you can select to draw the Bull & Bear profiles on the same x-point.
The indicator is robust enough to calculate on "long zig zags" and "short zig zags"; curved profiles can also be used!
The image above exemplifies usage of the indicator!
Bull & Bear volume profiles are calculated for trends on the 30-second timeframe.
The image above shows a more "utilitarian" presentation of the profiles. Once more, line and linefill colors/transparencies are all customizable; the indicator can look however you would like it to!
The image above shows key levels, the Bull vs. Bear profile, and volume delta for the current trend!
That's about it :D
This indicator is part of a series titled "Bull vs. Bear" - a suite of profile-like indicators I will be releasing over coming days. Thanks for checking this out!
Of course, a big thank you to @RicardoSantos for his MathOperator library that I use in every script.
If you have any suggestions please feel free to share!
Profil Wolumenu

PhantomFlow DynamicLevelsThe PhantomFlow Dynamic Levels indicator analyzes the dynamic volume over the period specified in the Period field. Channel boundaries can be used as dynamic support and resistance levels when trading within a range. The POC level also serves as a level at which the price may react during trend movements. The Period Multiplier parameter affects how many dynamic levels will be displayed. The Accuracy parameter influences the precision of volume calculations.
These levels are crucial for intraday traders as they serve as support or resistance. The Value Area zone includes 70% of the traded volume over the selected period. In other words, it represents the price region where the majority of traders believe the fair value for the asset lies.
The indicator's name, Dynamic Levels, aptly captures its essence. It analyzes trading volume at various price levels, tracking the sentiment dynamics of traders. When the asset's price decreases or increases as a result of trading, the Dynamic Levels indicator displays a new level on the chart. This results in a plotted line on the chart, allowing us to observe the movement dynamics of both the value area and the maximum volume level.
Standard indicators do not provide real-time visibility into level shifts, making the use of the Dynamic Levels indicator a competitive advantage in market trading across any time frame.
We borrowed the volume profile calculation code from @LonesomeTheBlue. Thank you for the work done!

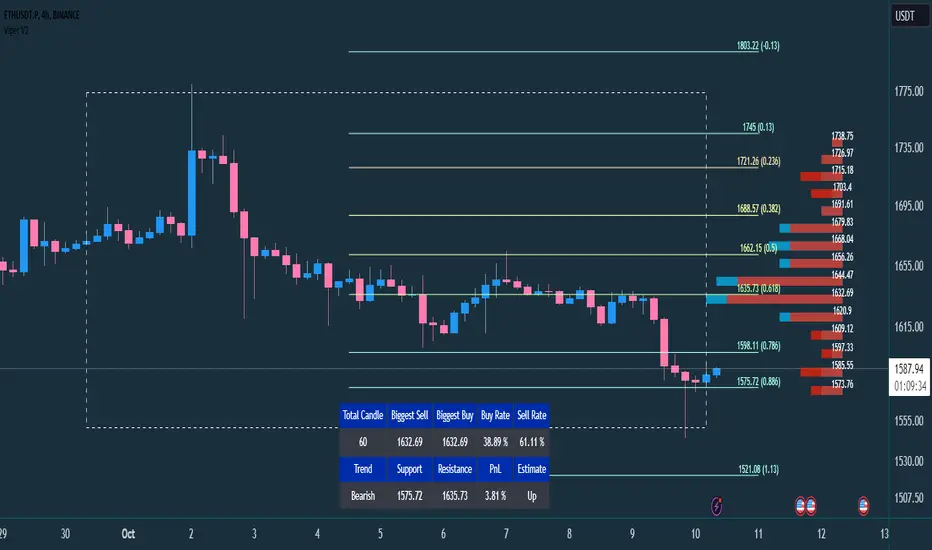
VIPER DOPING - A Volume Profile to estimate trend probabilityDESCRIPTION :
VIPER DOPING uses volume analysis to help trader to understand trading keys below:
Support and Resistance
Profit and Loss
Estimate candle direction
Trend
Biggest Buy and Sell on level prices
HOW TO USE:
The volume bar will have buy and sell colors, by default the buy color is blue and the sell is red. The size of bar is important matter, the biggest bar size means that price level has strong volume or transaction and the smallest bar size indicates the lowest transaction or volume. How to read it?
The bar above the candle is the resistance
The bar below the candle is the support
If you want long the market, find the biggest or bigger support, which is below the candle
If you want short the market, find the biggest or bigger resistance which is above the candle
Trading style and the maximum range (total candle), default is 60. This setup to analyze volumes in specific candle range. Please check the following recommendation based on trading style:
Scalping: 30 - 60 candles, recommendation timeframe: 5m - 1h
Day Trading: 50 - 120 candles, recommendation timeframe: 30m - 4h
Swing Trading: 100- 240 candles, recommendation timeframe: 1h- 3D
The white box is to visualize trading area by total candle. Every line has the meaning:
The left line is the start candle
The right line is the end candle
The top line is the highest price of volume profile
The bottom line is the lowest price of volume profile
The fibonacci line will help you to confirm and compare of supports and resistances with the volume profile lines.
The TABLE CELLS
it contains information to help trader to understand the recent situation of market and to take strategy of trading:
Total Candle : the maximum candles are used to analyze the volume from previous active candle
Biggest Sell : the horizontal price area which has the largest of sell volume of the last total candle
Biggest Buy : the horizontal price area which has the largest of buy volume of the last total candle
Buy Rate : the ratio of buy and sell volume of the last total candle
Support: the closest price to be the support from the active candle, auto changed if support to be invalid
Resistance : the closest price to be the resistance from the active candle, auto changed if support to be invalid
PnL : the percentage profit if you trade using the support and resistance prices and it can be used for Risk Management. Wisely the risk is 50% of the profit, example if the profit 1% the your risk should be 0.5% from entry.
Estimate : to analize the next direction of candle or target, it will be changed automatically by volume condition.
CONFIGURATION:
Table Position : You can change the table position to top or bottom, to left, right or center
Calculation : You can include the active candle in volume calculation or you can choose the behind active candle. If you use active candle, there could be possible repainting.
The volume profile configuration is about appearance configuration, to setup the thickness, colors, position.
The fibonacci configuration is about appearance configuration, to setup the thickness, extend lines, label styles.
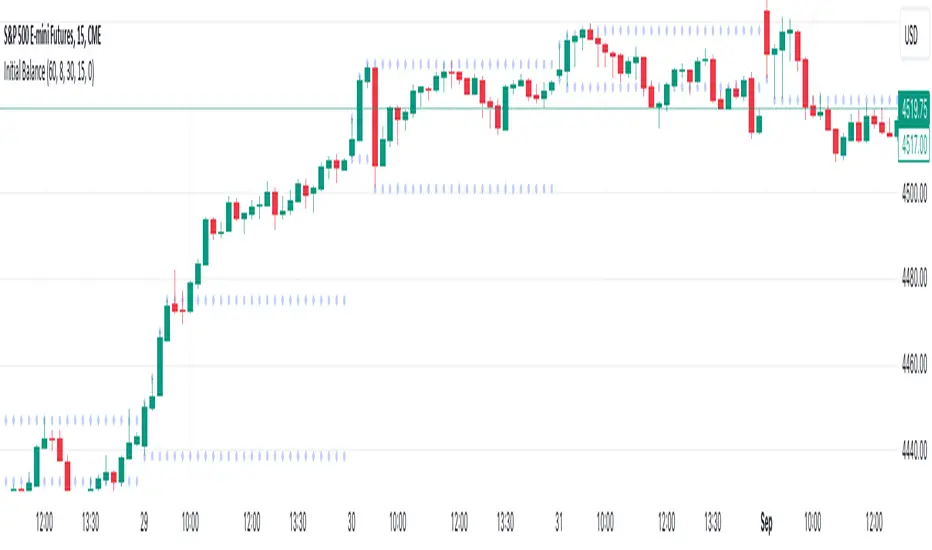
Initial Balance (customizable)Introducing the Initial Balance
Discover precision and clarity in your trading decisions with the Initial Balance. Crafted for traders who seek an edge, this tool pinpoints the range established during the first hour of the trading session, offering a holistic understanding of market sentiments right from the start.
Key Features:
Accurate Visualization: See the initial balance range plotted seamlessly on your chart, providing a transparent view of early market movement.
Customizable Timeframes: Whether you're an early bird catching the first market moves or prefer trading a bit later, set your own start time to fit your trading strategy.
Subtle Aesthetics: With non-intrusive lines and a customizable transparency setting, this indicator integrates smoothly with any chart, ensuring your view remains clear and undistracted.
Adaptable to Any Market: No matter your trading domain - be it stocks, forex, or commodities - this tool adjusts to offer valuable insights.
Why Use the Initial Balance Indicator?
Understanding the initial balance gives a trader the advantage of interpreting the day's potential trend. It's a reflection of early market consensus and serves as a foundation for the day's trading action. By leveraging this, you can better align your strategies with market momentum and improve your trading outcomes.
Add clarity and precision to your trading toolkit. Try the Initial Balance and elevate your trading insights.
Volume HeatMap With Profile [ChartPrime]The Volume Heatmap with Profile indicator is a tool designed to provide traders with a comprehensive view of market activity through customizable visualizations. This indicator goes beyond traditional volume analysis by offering a range of adjustable parameters and features that enhance analysis of volume and give a cleaner experience when analyzing it.
To get started click the start and end time for the profile.
Key Features:
Extended Calculation: This indicator extends its calculation to the last bar, ensuring that the user has insights into current market dynamics.
Point of Control (POC): Easily identify the price level at which the highest trading activity has occurred, helping the user pinpoint potential reversal points and significant support/resistance zones.
VWAP Point of Control: Display the Volume Weighted Average Price (VWAP) Point of Control, giving the user a clear reference for determining the average price traders are paying and potential price reversals.
Adjustable Colors for Heatmap: Change the heatmap colors to the users preference, allowing the user to match the indicator's appearance to their chart style and personal visual preferences.
Forecasted Zone: This feature allows traders to forecast areas of high activity by providing the option to adjust colors within this zone. This feature assists in identifying potential breakouts or areas where increased trading volume is anticipated.
Volume Profile: Customize the colors of the volume profile to make it distinct and easily distinguishable on the chart.
Adjustable Volume Levels: Specify the number volume levels that are most relevant to your trading strategy.
Adjustable Placement for Volume Profile: Position the volume profile on the chart. Whether the user prefers it on the left, right, or at the center of the chart, this indicator offers placement flexibility.
The ratio of bull vs bear volume is plotted on the outside of the range indicating how bullish or bearish price action is in a given range.

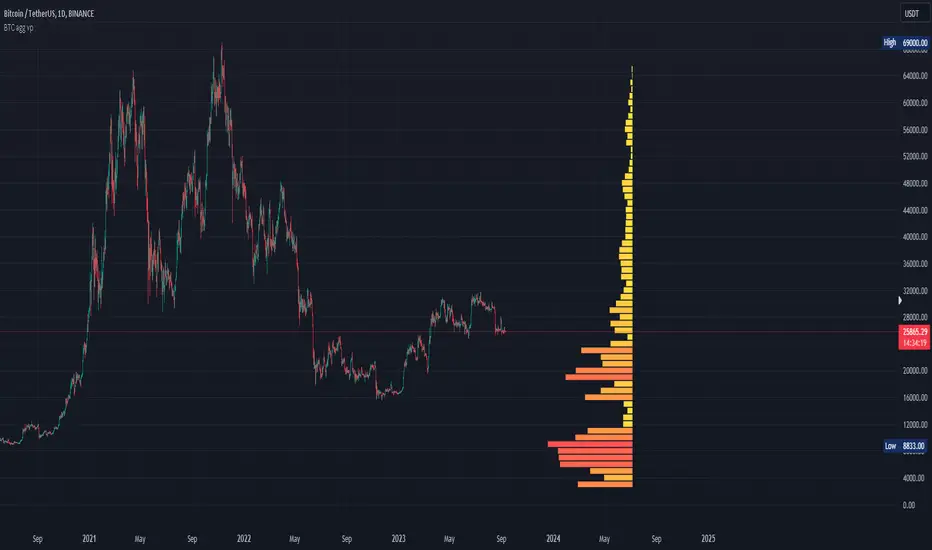
Bitcoin Aggregated Volume Profile «NoaTrader»If you use volume profile for analyzing Bitcoin, you may know that sometimes the decisions of big CEXs like Binance can change the volume of each symbol and so the analysis perceived from the data (which may not be valid anymore); Like when Binance decided to transfer the free transaction fee promotion from BTCUSDT to BTCTUSD pair or the new introduced BTCFDUSD pair with volume market share as much as BTCTUSD after only 1 month (according to the coinmarketcap's data).
This indicator tries to solve that problem for using volume profile. So, it collects all the volumes of different pairs from different exchanges and then uses all of them to calculate the volume profile.
Also, there is an option to compare the current symbols volume to the whole volume profile which is a Boolean option in the settings (the picture above)
The aggregated volume data includes:
BINANCE:BTCUSDT
BINANCE:BTCTUSD
BINANCE:BTCBUSD
BINANCE:BTCFDUSD
BINANCE:BTCDAI
BINANCE:BTCEUR
BITSTAMP:BTCUSDT
BITSTAMP:BTCUSD
COINBASE:BTCUSDT
COINBASE:BTCUSD
COINBASE:BTCEUR
HUOBI:BTCUSDT
KUCOIN:BTCUSDT
KRAKEN:XBTUSD
KRAKEN:XBTEUR
BITFINEX:BTCUSD
BYBIT:BTCUSDT
KRAKEN:BTCUSD
OKX:BTCUSDT
Volume Profile Segment Difference «NoaTrader»If you use volume profile, then you might have countered wanting to know a segment of the chart's volume profile relative to the whole volume profile. This indicator tries to solve that problem.
When you add it to the chart, first it asks you the start and end point of the segment you want, then it draws the whole chart's volume profile and shows the selected segments relative volume with a different color (blue default).
The default settings are good for a Bitcoin daily chart, so don't forget to change the settings for other symbols and timeframes.

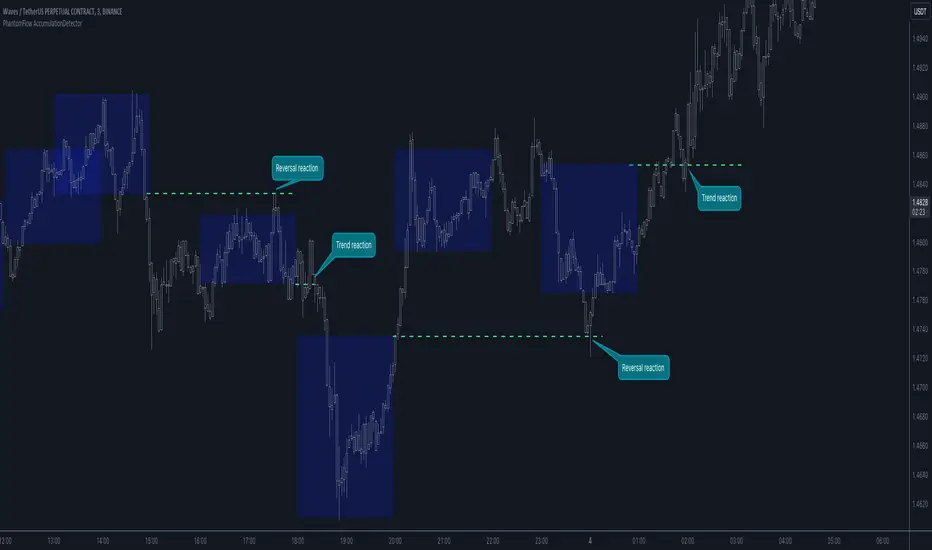
PhantomFlow AccumulationDetectorThe PhantomFlow AccumulationDetector indicator analyzes the volume profile and displays potential accumulation based on the selected timeframe in the settings. This indicator can be used both as zones for trend following and for identifying reversals, as shown in the examples on the chart. The logic behind the formation of the accumulation zone is based on the fact that the POC (Point of Control) of the current zone is within the Volume Area range of the previous period.
Optimal settings for the working timeframe should be chosen visually, and the size of the zones should not be too large or too small. Additionally, it's advisable not to consider overly wide zones during increased volatility.
Consecutive zones within the same range often indicate a potential reversal.
We borrowed the volume profile calculation code from @LonesomeTheBlue. Thank you for the work done!
Volume Profile - BearJust another Volume Profile but you can fit into your chart better by moving back and forth horizontally. also note you can fix the number of bars to show the volume by that way you can use a fib retracment to line up high/low volume nodes with fib levels... see where price as bad structure. or just play with the colors to make a cool gradient?
Volume Profile is a technical analysis tool used by traders to analyze the distribution of trading volume at different price levels within a specified time frame. It helps traders identify key support and resistance levels, potential areas of price reversals, and areas of high trading interest. Here's how to read Volume Profile on a trading chart:
1. **Choose a Time Frame**: Decide on the time frame you want to analyze. Volume Profile can be applied to various time frames, such as daily, hourly, or even minute charts. The choice depends on your trading style and goals.
2. **Plot the Volume Profile**: Once you have your chart open, add the Volume Profile indicator. Most trading platforms offer this tool. It typically appears as a histogram or a series of horizontal bars alongside the price chart.
3. **Identify Key Elements**:
a. **Value Area**: The Value Area represents the price range where the majority of trading volume occurred. It is often divided into three parts: the Point of Control (POC) and the upper and lower value areas. The POC is the price level where the most trading activity occurred and is considered a significant support or resistance level.
b. **High-Volume Nodes**: High-volume nodes are price levels where there was a significant amount of trading volume. These nodes can act as support or resistance levels because they represent areas where many traders had their positions.
c. **Low-Volume Areas**: Conversely, low-volume areas are price levels with little trading activity. These areas may not provide strong support or resistance because they lack significant trader interest.
4. **Interpretation**:
- If the price is trading above the POC and the upper value area, it suggests bullish sentiment, and these levels may act as support.
- If the price is trading below the POC and the lower value area, it suggests bearish sentiment, and these levels may act as resistance.
- High-volume nodes can also act as support or resistance, depending on the price's current position relative to them.
5. **Confirmation**: Volume Profile should be used in conjunction with other technical analysis tools and indicators to confirm trading decisions. Consider using trendlines, moving averages, or other price patterns to validate your trading strategy.
6. **Adjust for Different Time Frames**: Keep in mind that Volume Profile analysis can yield different results on different time frames. For example, a support level on a daily chart may not hold on a shorter time frame due to intraday volatility.
7. **Practice and Experience**: Like any trading tool, reading Volume Profile requires practice and experience. Analyze historical charts, paper trade, and refine your strategies over time to gain proficiency.
8. **Stay Informed**: Stay updated with market news and events that can impact trading volume. Sudden news can change the significance of volume levels.

Liquidity Sentiment Profile (Auto-Anchored) [LuxAlgo]
The Liquidity Sentiment Profile (Auto-Anchored) is an advanced charting tool that measures by combining PRICE and VOLUME data over specified anchored periods and highlights the distribution of the liquidity and the market sentiment at specific price levels. This version is a variation of the previously published Liquidity Sentiment Profile , wherewith this version allows users to select a variety of different anchoring periods, such as 'Auto', 'Fixed Range', 'Swing High', 'Swing Low', 'Session', 'Day', 'Week', 'Month', 'Quarter', and 'Year'
Liquidity refers to the availability of orders at specific price levels in the market, allowing transactions to occur smoothly.
🔶 USAGE
A Liquidity Sentiment Profile (Auto-Anchored) is a combination of liquidity and a sentiment profile, where the right side of the profile highlights the distribution of the traded activity at different price levels, and the left side of the profile highlights the market sentiment at those price levels
The liquidity profile is categorized by assigning different colors based on the significance of the traded activity of the specific price levels, allowing traders to reveal significant price levels, such as support and resistance levels, supply and demand zones, liquidity gaps, consolidation zones, etc
The Liquidity Sentiment Profiles aim to present Value Areas based on the significance of price levels, thus allowing users to identify value areas that can be formed more than once within the range of a single profile
Level of Significance Line - displays the changes in the price levels with the highest traded activity (developing POC)
Buyside & Sellside Liquidity Zones - displays Liquidity Levels, also known as Supply and Demand Zones
🔶 SETTINGS
The script takes into account user-defined parameters and plots the profiles, where detailed usage for each user-defined input parameter in indicator settings is provided with the related input's tooltip.
🔹 Liquidity Sentiment Profile
Anchor Period: The indicator resolution is set by the input of the Anchor Period.
Fixed Period: Applicable if the Anchor Period is set to 'Fixed Range' then the period of the profile is defined with this option
Swing Detection Length: Applicable if the Anchor Period is set to 'Swing High' or 'Swing Low' then the length required to detect the Swing Levels is defined with this option which is then used to determine the period of the profile
🔹 Liquidity Profile
Liquidity Profile: Toggles the visibility of the Liquidity Profiles
High Traded Nodes: Threshold and Color option for High Traded Nodes
Average Traded Nodes: Color option for Average Traded Nodes
Low Traded Nodes: Threshold and Color option for Low Traded Nodes
🔹 Sentiment Profile
Sentiment Profile: Toggles the visibility of the Sentiment Profiles
Bullish Nodes: Color option for Bullish Nodes
Bearish Nodes: Color option for Bearish Nodes
🔹 Buyside & Sellside Liquidity Zones
Buyside & Sellside Liquidity Zones: Toggles the visibility of the Liquidity Levels
Buyside Liquidity Nodes: Color option for Buyside Liquidity Nodes
Sellside Liquidity Nodes: Color option for Sellside Liquidity Nodes
🔹 Other Settings
Level of Significance: Toggles the visibility of the Level of Significance Line
Price Levels, Color: Toggles the visibility of the Profile Price Levels
Number of Rows: Specify how many rows each profile histogram will have. Caution, having it set to high values will quickly hit Pine Script™ drawing objects limit and fewer historical profiles will be displayed
Profile Width %: Alters the width of the rows in the histogram, relative to the profile length
Profile Range Background Fill: Toggles the visibility of the Profiles Range
🔶 RELATED SCRIPTS
Liquidity-Sentiment-Profile
Buyside-Sellside-Liquidity
ICT-Concepts

Dynamic Point of Control (POC)The Dynamic Point of Control (POC) indicator provides traders and analysts with insightful information about price levels, volume distribution, and sentiment within a specified historical range.
Instant Updates : POC recalculates with every new bar, keeping you ahead of the game.
Market Bias : Assess market sentiment through bullish volume share.
Customization : Tailor inputs to match your unique trading strategy.
Chart Presence : See POC and related data graphically on your price chart.
How to Use :
Traders can use the Dynamic POC indicator to identify Point of Control price level, understand volume distribution, and gauge market sentiment. The indicator's visual cues and customizable parameters make it a valuable tool for technical analysis and decision-making.

Volume Profile (Maps) [LuxAlgo]The Pine Script® developers have unleashed "maps"!
Volume Profile (Maps) displays volume, associated with price, above and below the latest price, by using maps
The largest and second-largest volume is highlighted.
🔶 USAGE
The proposed script can highlight more frequent closing prices/prices with the highest volume, potentially highlighting more liquid areas. The prices with the highest associated volume (in red and orange in the indicator) can eventually be used as support/resistance levels.
Voids within the volume profile can highlight large price displacements (volatile variations).
🔶 CONCEPTS
🔹 Maps
A map object is a collection that consists of key - value pairs
Each key is unique and can only appear once. When adding a new value with a key that the map already contains, that value replaces the old value associated with the key .
You can change the value of a particular key though, for example adding volume (value) at the same price (key), the latter technique is used in this script.
Volume is added to the map, associated with a particular price (default close, can be set at high, low, open,...)
When the map already contains the same price (key), the value (volume) is added to the existing volume at the associated price.
A map can contain maximum 50K values, which is more than enough to hold 20K bars (Basic 5K - Premium plan 20K), so the whole history can be put into a map.
🔹 Visible line/box limit
We can only display maximum 500 line.new() though.
The code locates the current (last) close, and displays volume values around this price, using lines, for example 250 lines above and 250 lines below current price.
If one side contains fewer values, the other side can show more lines, taking the maximum out of the 500 visible line limitation.
Example (max. 500 lines visible)
• 100 values below close
• 2000 values above close
-> 100 values will be displayed below close
-> 400 remaining -> 400 values will be displayed above close
Pushing the limits even further, when ' Amount of bars ' is set higher than 500, boxes - box.new() - will be used as well.
These have a limit of 500 as well, bringing the total limit to 1000.
Note that there are visual differences when boxes overlap against lines.
If this is confusing, please keep ' Amount of bars ' at max. 500 (then only lines will be used).
🔹 Rounding function
This publication contains 2 round functions, which can be used to widen the Volume Profile
Round
• "Round" set at zero -> nothing changes to the source number
• "Round" set below zero -> x digit(s) after the decimal point, starting from the right side, and rounded.
• "Round" set above zero -> x digit(s) before the decimal point, starting from the right side, and rounded.
Example: 123456.789
0->123456.789
1->123456.79
2->123456.8
3->123457
-1->123460
-2->123500
Step
Another option is custom steps.
After setting "Round" to "Step", choose the desired steps in price,
Examples
• 2 -> 1234.00, 1236.00, 1238.00, 1240.00
• 5 -> 1230.00, 1235.00, 1240.00, 1245.00
• 100 -> 1200.00, 1300.00, 1400.00, 1500.00
• 0.05 -> 1234.00, 1234.05, 1234.10, 1234.15
•••
🔶 FEATURES
🔹 Adjust position & width
🔹 Table
The table shows the details:
• Size originalMap : amount of elements in original map
• # higher: amount of elements, higher than last "close" (source)
• index "close" : index of last "close" (source), or # element, lower than source
• Size newMap : amount of elements in new map (used for display lines)
• # higher : amount of elements in newMap, higher than last "close" (source)
• # lower : amount of elements in newMap, lower than last "close" (source)
🔹 Volume * currency
Let's take as example BTCUSD, relative to USD, 10 volume at a price of 100 BTCUSD will be very different than 10 volume at a price of 30000 (1K vs. 300K)
If you want volume to be associated with USD, enable Volume * currency . Volume will then be multiplied by the price:
• 10 volume, 1 BTC = 100 -> 1000
• 10 volume, 1 BTC = 30K -> 300K
Disabled
Enabled
🔶 DETAILS
🔹 Put
When the map doesn't contain a price, it will be added, using map.put(id, key, value)
In our code:
map.put(originalMap, price, volume)
or
originalMap.put(price, volume)
A key (price) is now associated with a value (volume) -> key : value
Since all keys are unique, we don't have to know its position to extract the value, we just need to know the key -> map.get(id, key)
We use map.get() when a certain key already exists in the map, and we want to add volume with that value.
if originalMap.contains(price)
originalMap.put(price, originalMap.get(price) + volume)
-> At the last bar, all prices (source) are now associated with volume.
🔹 Copy & sort
Next, every key of the map is copied and sorted (array of keys), after which the index (idx) is retrieved of last (current) price.
copyK = originalMap.keys().copy()
copyK.sort()
idx = copyK.binary_search_leftmost(src)
Then left and right side of idx is investigated to show a maximum amount of lines at both sides of last price.
🔹 New map & display
The keys (from sorted array of copied keys) that will be displayed are put in a new map, with the associated volume values from the original map.
newMap = map.new()
🔹 Re-cap
• put in original amp (price key, volume value)
• copy & sort
• find index of last price
• fetch relevant keys left/right from that index
• put keys in new map and fetch volume associated with these keys (from original map)
Simple example (only show 5 lines)
bar 0, price = 2, volume = 23
bar 1, price = 4, volume = 3
bar 2, price = 8, volume = 21
bar 3, price = 6, volume = 7
bar 4, price = 9, volume = 13
bar 5, price = 5, volume = 85
bar 6, price = 3, volume = 13
bar 7, price = 1, volume = 4
bar 8, price = 7, volume = 9
Original map:
Copied keys array:
Sorted:
-> 5 keys around last price (7) are fetched (5, 6, 7, 8, 9)
-> keys are placed into new map + volume values from original map
Lastly, these values are displayed.
🔶 SETTINGS
Source : Set source of choice; default close , can be set as high , low , open , ...
Volume & currency : Enable to multiply volume with price (see Features )
Amount of bars : Set amount of bars which you want to include in the Volume Profile
Max lines : maximum 1000 (if you want to use only lines, and no boxes -> max. 500, see Concepts )
🔹 Round -> ' Round/Step '
Round -> see Concepts
Step -> see Concepts
🔹 Display Volume Profile
Offset: shifts the Volume Profile (max. 500 bars to the right of last bar, see Features )
Max width Volume Profile: largest volume will be x bars wide, the rest is displayed as a ratio against largest volume (see Features )
Show table : Show details (see Features )
🔶 LIMITATIONS
• Lines won't go further than first bar (coded).
• The Volume Profile can be placed maximum 500 bar to the right of last price.
• Maximum 500 lines/boxes can be displayed

Filtered Volume Profile [ChartPrime]The "Filtered Volume Profile" is a powerful tool that offers insights into market activity. It's a technical analysis tool used to understand the behavior of financial markets. It uses a fixed range volume profile to provide a histogram representing how much volume occurred at distinct price levels.
Profile in action with various significant levels displayed
How to Use
The script is designed to analyze cumulative trading volumes in different price bins over a certain period, also known as `'lookback'`. This lookback period can be defined by the user and it represents the number of bars to look back for calculating levels of support and resistance.
The `'Smoothing'` input determines the degree to which the output is smoothed. Higher values lead to smoother results but may impede the responsiveness of the indicator to rapid changes in volatility.
The `'Peak Sensitivity'` input is used to adjust the sensitivity of the script's peak detection algorithm. Setting this to a lower value makes the algorithm more sensitive to local changes in trading volume and may result in "noisier" outputs.
The `'Peak Threshold'` input specifies the number of bins that the peak detection mechanism should account for. Larger numbers imply that more volume bins are taken into account, and the resultant peaks are based on wider intervals.
The `'Mean Score Length'` input is used for scaling the mean score range. This is particularly important in defining the length of lookback bars that will be used to calculate the average close price.
Sinc Filter
The application of the sinc-filter to the Filtered Volume Profile reduces the risk of viewing artefacts that may misrepresent the underlying market behavior. Sinc filtering is a high-quality and sharp filter that doesn't manifest any ringing effects, making it an optimal choice for such volume profiling.
Histogram
On the histogram, the volume profile is colored based on the balance of bullish to bearish volume. If a particular bar is more intense in color, it represents a larger than usual volume during a single price bar. This is a clear signal of a strong buying or selling pressure at a particular price level.
Threshold for Peaks
The `peak_thresh` input determines the number of bins the algorithm takes in account for the peak detection feature. The 'peak' represents the level where a significant amount of volume trading has occurred, and usually is of interest as an indicative of support or resistance level.
By increasing the `peak_thresh`, you're raising the bar for what the algorithm perceives as a peak. This could result in fewer, but more significant peaks being identified.
History of Volume Profiles and Evolution into Sinc Filtering
Volume profiling has a rich history in market analysis, dating back to the 1950s when Richard D. Wyckoff, a legendary trader, introduced the concept of volume studies. He understood the critical significance of volume and its relationship with market price movement. The core of Wyckoff's technical analysis suite was the relationship between prices and volume, often termed as "Effort vs Results".
Moving forward, in the early 1800s, the esteemed mathematician J. R. Carson made key improvements to the sinc function, which formed the basis for sinc filtering application in time series data. Following these contributions, trading studies continued to create and integrate more advanced statistical measures into market analysis.
This culminated in the 1980s with J. Peter Steidlmayer’s introduction of Market Profile. He suggested that markets were a function of continuous two-way auction processes thus introducing the concept of viewing markets in price/time continuum and price distribution forms. Steidlmayer's Market Profile was the first wide-scale operation of organized volume and price data.
However, despite the introduction of such features, challenges in the analysis persisted, especially due to noise that could misinform trading decisions. This gap has given rise to the need for smoothing functions to help eliminate the noise and better interpret the data. Among such techniques, the sinc filter has become widely recognized within the trading community.
The sinc filter, because of its properties of constructing a smooth passing through all data points precisely and its ability to eliminate high-frequency noise, has been considered a natural transition in the evolution of volume profile strategies. The superior ability of the sinc filter to reduce noise and shield against over-fitting makes it an ideal choice for smoothing purposes in trading scripts, particularly where volume profiling forms the crux of the market analysis strategy, such as in Filtered Volume Profile.
Moving ahead, the use of volume-based studies seems likely to remain a core part of technical analysis. As long as markets operate based on supply and demand principles, understanding volume will remain key to discerning the intent behind price movements. And with the incorporation of advanced methods like sinc filtering, the accuracy and insight provided by these methodologies will only improve.
Mean Score
The mean score in the Filtered Volume Profile script plays an important role in probabilistic inferences regarding future price direction. This score essentially characterizes the statistical likelihood of price trends based on historical data.
The mean score is calculated over a configurable `'Mean Score Length'`. This variable sets the window or the timeframe for calculation of the mean score of the closing prices.
Statistically, this score takes advantage of the concept of z-scores and probabilities associated with the t-distribution (a type of probability distribution that is symmetric and bell-shaped, just like the standard normal distribution, but has heavier tails).
The z-score represents how many standard deviations an element is from the mean. In this case, the "element" is the price level (Point of Control).
The mean score section of the script calculates standard errors for the root mean squared error (RMSE) and addresses the uncertainty in the prediction of the future value of a random variable.
The RMSE of a model prediction concerning observed values is used to measure the differences between values predicted by a model and the values observed.
The lower the RMSE, the better the model is able to predict. A zero RMSE means a perfect fit to the data. In essence, it's a measure of how concentrated the data is around the line of best fit.
Through the mean score, the script effectively predicts the likelihood of the future close price being above or below our identified price level.
Summary
Filtered Volume Profile is a comprehensive trading view indicator which utilizes volume profiling, peak detection, mean score computations, and sinc-filter smoothing, altogether providing the finer details of market behavior.
It offers a customizable look back period, smoothing options, and peak sensitivity setting along with a uniquely set peak threshold. The application of the Sinc Filter ensures a high level of accuracy and noise reduction in volume profiling, making this script a reliable tool for gaining market insights.
Furthermore, the use of mean score calculations provides probabilistic insights into price movements, thus providing traders with a statistically sound foundation for their trading decisions. As trading markets advance, the use of such methodologies plays a pivotal role in formulating effective trading strategies and the Filtered Volume Profile is a successful embodiment of such advancements in the field of market analysis.

Price Range Volume Profile [Pt]█ Introduction
The Price Range Volume Profile (PRVP) is a revolutionary indicator. This tool stands out from its peers due to its unique ability to capture the entire price chart history, thus providing a comprehensive volume profile of the entire asset's trading history, as available on TradingView chart. It's worth noting that I believe this tool is the first of its kind to accomplish such a feat. A much recommended tool if you are a volume profile trader.
█ Main Features
► Historical Lookback: This feature dives deep into the past, grasping all the historical data of an asset. It's equipped to handle up to 20,000 bars, although users without a premium TradingView account are advised to keep it at a maximum of 10,000 bars, or just use the "Full Historical Lookback" feature.
► Volume Profile / POC: Displays the distribution of volume across price levels for the selected price range. The Point of Control (POC), which is the price level with the highest traded volume, is also highlighted.
► Customization: Users have the flexibility to adjust the profile's appearance, including profile width, horizontal offset, and the option to fill the background of the profile range.
► Time Weighting: This feature allows users to give more weight to recent trading activity, which can be especially useful for intraday traders or during times of high volatility. Note that this feature will impact the volume profile and POC level.
► Settings Table: A settings table is displayed on the chart for users to quickly reference their input parameters.
█ Input Parameters
► Lookback Timeframe: Determines the period for which the volume profile is generated.
► Price Range: The percentage distance to consider for the profile, adjusted above and below the current closing price.
► Profile Step size: The granularity of the volume profile. Users can opt for automatic step size based on a predefined calculation or set their preferred tick step size.
► Historical Bars Lookback: Determines the number of bars to include in the volume profile calculation.
► Profile Visuals: Adjust the appearance and layout of the volume profile on the chart.
► Extra: Additional settings including the display of a settings table and its location.
█ Basic Understanding of Volume Profile - How to use PRVP?
Volume Profile is a valuable tool for traders who want insights into where the majority of trading activity has occurred. Here are some tips to make the most of it:
► Understand the Basics: Before using the Volume Profile, ensure you understand the difference between it and the standard volume histogram. While both represent volume, the former displays it against price while the latter shows it against time.
► Identify High Volume Nodes (HVN) and Low Volume Nodes (LVN):
◊ HVN: Areas where there's a lot of trading activity and where the price has spent a lot of time. These areas can act as strong support or resistance.
◊ LVN: Areas where there's a lack of trading activity. Prices might move quickly through these areas, and they can act as potential breakpoints or accelerators for price movement.
► Locate the Point of Control (POC): This is the price level with the highest traded volume for a specified period. It often acts as a magnet for price, and it can serve as a pivot or reference point.
► Trend Confirmation: A shift in the volume profile from one price level to another can confirm a trend. For instance, if higher volume starts to build at higher price levels, it may indicate a strong uptrend.
► Watch for Volume Gaps: If there's a significant gap in the volume profile, prices may move quickly through these levels as there's little historical trading activity to act as support or resistance.
█ Other Usage Tips
◊ For optimal performance, ensure that the chosen timeframe aligns closely with the chart timeframe. Differences in timeframes may lead to minor discrepancies in the volume profile.
◊ To address any errors arising from too many levels displayed on the volume profile, consider increasing the Profile Step size or reducing the Price Range.

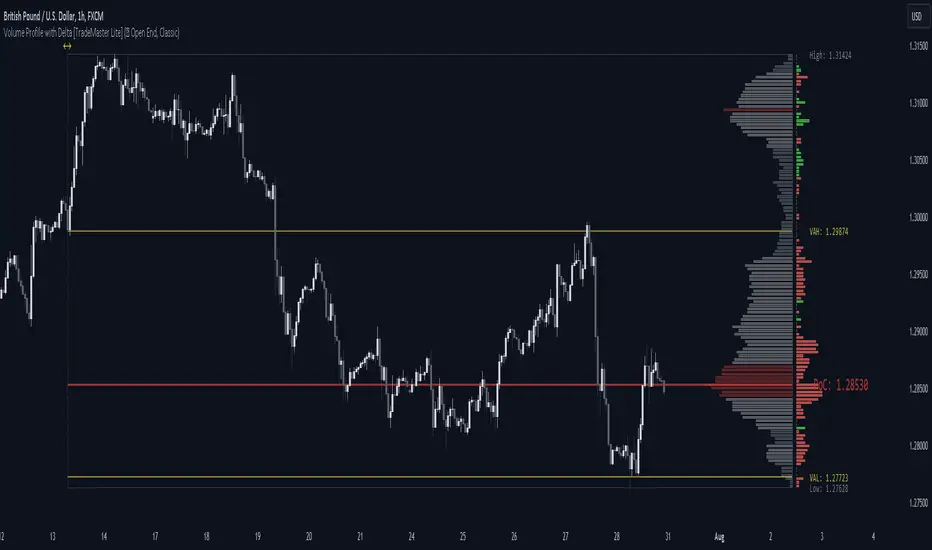
Volume Profile with Delta [TradeMaster Lite]The indicator estimates and displays the total traded volume and it's delta** at each price level during the user-defined period. It can be used to identify key support and resistance levels, determine logical take profit and stop loss levels, identify balanced and unbalanced markets and determine trend strength. The indicator offers different approaches to visualize the volume profile and can be chosen based on your preferred trading strategy and analysis method. The position and size of the Volume Profile is fully customizable, it can even be flipped if needed!
Three different display types (cosmetic effect only):
Classic
Compact
Modern
The Lite version offers three different range types:
Visible Range: displays the volume profile for the visible range of bars or candles on the chart. It adjusts dynamically as you change the chart view making it ideal for the modern trader who values both precision and simplicity.
Open End: displays the volume profile from a specific start date without a defined end, including real delta data. It provides an overview of the volume activity across all price levels of the examined period.
Fixed End: lets you define a specific start and end point for the volume profile. It can be useful if you want to analyze the volume activity within a specific time period or price range.
👉 Usage
The Volume Profile is a histogram that shows the estimated trading volume at certain price levels, how much was sold and how much was bought of the asset. The longer the histogram, the greater the trading volume at that price level. The Delta estimates which side was dominant at that price level and by how much.
To make the most out of the indicator, you can look for
pullbacks to high volume nodes or value areas,
initial equilibrium pullbacks,
buy or sell opportunities for price reversals,
institutional order flow.
The largest histogram node is called the Point of Control (POC). It is the estimated real market price of a coin. There's a common belief that when the price is above this point, the market sentiment is bullish, and when it's below, the sentiment turns bearish. It can act as a strong support if the price is above it and as strong resistance if the price is below it.
Price action usually finds the most support and resistance and the edge of the high volume areas. The indicator can mark these as VAH and VAL (Value Area High and Low).
In addition to the indication of support and resistance zones, the volume profile can also be used to infer the speed of price movements. At levels where there is little trading volume, faster and more volatile price movements are expected. In such scenarios the price may fall or rise faster to the next high volume zone.
👉 General advice
Confirming Signals with other indicators:
As with all technical indicators, it is important to confirm potential signals with other analytical tools, such as support and resistance levels, as well as indicators like RSI, MACD, and volume. This helps increase the probability of a successful trade.
Use proper risk management:
When using this or any other indicator, it is crucial to have proper risk management in place. Consider implementing stop-loss levels and thoughtful position sizing.
Combining with other technical indicators:
The indicator can be effectively used alongside other technical indicators to create a comprehensive trading strategy and provide additional confirmation.
Keep in Mind:
Thorough research and backtesting are essential before making any trading decisions. Furthermore, it's crucial to have a solid understanding of the indicator and its behavior. Additionally, incorporating fundamental analysis and considering market sentiment can be vital factors to take into account in your trading approach.
Limitations:
The Lite version shows simple delta with current timeframe volume data.
The indicators within the TradeMaster Lite package aim for simplicity and efficiency, while retaining their original purpose and value. Some settings, functions or visuals may be simpler than expected.
**The Delta estimates which side was dominant at that price level and by how much. It is the difference between bull and bear volume of the candle.
⭐ Conclusion
We hold the view that the true path to success is the synergy between the trader and the tool, contrary to the common belief that the tool itself is the sole determinant of profitability. The actual scenario is more nuanced than such an oversimplification. Our aim is to offer useful features that meet the needs of the 21st century and that we actually use.
🛑 Risk Notice:
Everything provided by trademasterindicator – from scripts, tools, and articles to educational materials – is intended solely for educational and informational purposes. Past performance does not assure future returns.
Historic Volume/Market ProfilesHistoric Volume/Market Profile is a Periodic Volume Profile with all of the improvements known in the original Volume/Market Profile.
VMP is a 2 in 1 Volume and Market Profile Indicator.
HVMP uses the base of VMP to offer a quick and simple view at multiple historic profiles at the same time.
This includes:
Cluster Identification for High Volume and Low Volume Areas.
Maximizing granularity by utilizing boxes and lines to get up to 1000 rows.
New Inclusions in HVMP vs VMP:
HVMP granularity is determined by the # of profiles on display. By doing this, each profile will get an even amount of allocated rows to use and granularity is scaled per-profile, to fit within the row allowance.
For Example: 1000/(# of profiles) = Maximum # of rows per profile.
HVMP introduces the "Auto-Scale" Option (on by Default), this automatically fits each profile within the defined timeframe period to provide a consistent display when switching timeframes.
Even with "Auto-Scale" enabled, "Display Size" dictates which direction the profile is displayed.
Below is a Negative Display Size (Displays from right to left, starting at the end of the period)
Below is a Positive Display Size (Displays from left to right, starting at the beginning of the period)
HVMP is only for historical data, you can get a live profile with the same Node Identification using VMP (Volume Market/Profile). The indicator that this one is based on.
Find it Here: Volume/Market Profile
Enjoy!

Time Profile [QuantVue]The Time Profile indicator provides traders with a comprehensive view of volume and time-based price activity. The indicator combines two essential components into one indicator: the volume profile and the time profile.
The volume profile represents the distribution of trading volume at different price levels over a specified period and is displayed as a circle on the chart.
It provides a visual representation of where the majority of trading volume occurred and often highlights significant support and resistance levels. The volume profile is calculated as the closing price of the highest volume intraday bar, based on the user selected lower time frame.
On the other hand, the time profile focuses on analyzing the time spent at certain price levels. The indicator divides the current bars range into 10 blocks and counts the number of user selected lower time frame closes within each time block.
The block with the most lower time frame closes in it is deemed the time point of control. Traders can use this information to identify time blocks where price movement was most significant.
The time profile is drawn on the Y axis of the current bar to allow for an easy visualization of where price spent most of its time. Historical time profiles are also noted on previous bars with a dash marking the level.
The Time Profile indicator offers several customization options. Traders can adjust the timeframe for the lower time frame data, decide whether to display the time profile, and customize colors for visual clarity.
Additionally, traders can choose to highlight instances where the Volume POC and Time POC align, indicating a strong concentration of volume and price activity.
Don't hesitate to reach out with any questions or concerns.
We hope you enjoy!
Cheers.

Price & Volume Profile (Expo)█ Overview
The Price & Volume Profile provides a holistic perspective on market dynamics by simultaneously tracking price action and trading volume across a range of price levels. So it is not only a volume-based indicator but also a price-based one. In addition to illustrating volume distribution, it quantifies how frequently the price has fallen within a particular range, thus offering a holistic perspective on market dynamics.
This unique and comprehensive approach to market analysis by considering both price action and trading volume, two crucial dimensions of market activity. Its distinctive methodology offers several advantages:
Holistic Market View: By simultaneously tracking the frequency of specific price ranges (Price Profile) and the volume traded at those ranges (Volume Profile), this indicator provides a more complete picture of market behavior. It shows not only where the market is trading but also how much it's trading, reflecting both price acceptance levels and market participation intensity.
Point of Control (POC): The POC, as highlighted by this indicator, serves as a significant reference point for traders. It identifies the price level with the highest trading activity, thus indicating a strong consensus among market participants about the asset's fair value. Observing how price interacts with the POC can offer valuable insights into market sentiment and potential trend reversals.
Support and Resistance Levels: Price levels with high trading activity often act as support or resistance in future price movements. The indicator visually represents these levels, enabling traders to anticipate potential price reactions.
Price Profile
Price and Volume Profile
█ Calculations
The algorithm analyzes both trade frequency and volume across different price levels. It identifies these levels within the visible chart range, then examines each bar to determine if the selected price falls within these levels. If so, it increases a counter and adds the trading volume. This process repeats across the visible range and is visualized as a horizontal histogram, each bar representing a price level and the bar length reflecting trade frequency and volume. Additionally, it calculates the Point of Control (POC), signifying the price level with the highest activity.
In summary: The histogram presents a dual perspective - not only the traded volume at each price level but also the frequency of the price hitting each range. The longer the bar, the more times the price has frequented that specific range, revealing key insights into price behavior and acceptance levels. These frequently visited areas often emerge as strong support or resistance zones, helping traders navigate market movements.
Please note that the indicator adjusts to the visible price range, making it adaptable to changing market conditions. This dynamic analysis can provide more relevant and timely information than static indicators.
█ How to use
This indicator is beneficial for traders as it offers insights into the distribution of trading activity across different price levels. It helps identify key areas of support and resistance and gives a visual representation of market sentiment and liquidity.
The point of control (POC) , which is the price level with the highest traded volume or frequency count, becomes even more crucial in this context. It marks the price at which the most trading activity occurred, signaling a strong consensus among market participants about the asset's fair value. If the market price deviates significantly from the POC, it could suggest an overbought or oversold condition, potentially leading to a price reversion.
Fair Price Areas/gaps are specific price levels or zones where an asset has spent limited time in the past. These areas are considered interesting or significant because they may have an impact on future price action.
Similar to the concept of fair value gaps, which refers to discrepancies between an asset's market price and its estimated intrinsic value, Fair Price Areas/gaps focus on price levels that have been relatively underutilized in terms of trading activity. When an asset's price reaches a Fair Price Area/gap, traders and investors pay attention because they expect the price to react in some way. The rationale behind this concept is that price tends to gravitate towards areas where it has spent less time in the past, as the market perceives them as significant levels.
█ Settings
The indicator is customizable, allowing users to define the number of price levels (rows), the offset, the data source, and whether to display volume or frequency count. It also adjusts dynamically to the visible price range on the chart, ensuring that the analysis remains relevant and timely with changing market conditions.
Source: The price to use for the calculation. Typically, this is the closing price. By considering the user-selected Source (typically the closing price), the indicator determines the frequency with which the price lands within each designated price level (row) over the selected period. In essence, the indicator provides a count of bars where the Source price falls within each range, essentially creating a "Price Profile."
Row Size: The number of price levels (rows) to divide the visible price range into.
Display: Choose whether to display the number of bars ("Counter") or the total volume ("Volume") for each price level.
Offset: The distance of the histogram from the price chart.
Point of Control (POC): If enabled, the indicator will highlight the price level with the most activity.
-----------------
Disclaimer
The information contained in my Scripts/Indicators/Ideas/Algos/Systems does not constitute financial advice or a solicitation to buy or sell any securities of any type. I will not accept liability for any loss or damage, including without limitation any loss of profit, which may arise directly or indirectly from the use of or reliance on such information.
All investments involve risk, and the past performance of a security, industry, sector, market, financial product, trading strategy, backtest, or individual's trading does not guarantee future results or returns. Investors are fully responsible for any investment decisions they make. Such decisions should be based solely on an evaluation of their financial circumstances, investment objectives, risk tolerance, and liquidity needs.
My Scripts/Indicators/Ideas/Algos/Systems are only for educational purposes!

Volume Forks [Trendoscope]🎲 Volume Forks - Advanced Price Analysis with Recursive Auto-Pitchfork and Angled Volume Profile
The Volume Forks Indicator is a comprehensive research tool that combines two innovative techniques, Recursive Auto-Pitchfork and Angled Volume Profile . This indicator provides traders with valuable insights into price dynamics by integrating accurate pitchfork drawing and volume analysis over angled levels. The indicator does following things
Detects Pitchfork formations automatically on the chart over Recursive Zigzag
Instead of drawing forks based on fib levels, volume distribution over ABC of pitchfork is calculated and drawn in the direction of the handle.
🎲 Brief about Pitchfork
Pitchfork is drawn when price forms ABC pattern. Pitchfork draws a series of parallel lines in the direction of trend which can be used for support and resistance.
There are many methods of drawing pitchfork. In all cases, a line joining BC will make the base of pitchfork and fork lines are drawn from different points of the base. All the fork lines will be parallel. But, the handle of the base defines the direction of fork lines. Classification of pitchfork is mainly based on the starting and ending points of the handle.
🎲 Regular Types
Here, end of the handle is always fixed and it will be the mid point of B and C.
🎯 Andrews Pitchfork
Handle starts from A and joins the base at mid of B and C.
Forks are drawn based on fib ratios from the handle
🎯 Schiff Pitchfork
Handle starts from Bar of A and price of middle of AB and joins the base at mid of B and C
Forks are drawn based on fib ratios from the handle
🎯 Modified Schiff Pitchfork
Handle starts from mid of A and B and joins the base at mid of B and C
Forks are drawn based on fib ratios from the handle
🎲 Inside Types
Here, C will act as end of the handle which joins the Base BC .
🎯 Andrews Pitchfork (Inside)
Handle starts from A and joins the base at C
Forks are drawn based on fib ratios from the handle
🎯 Schiff Pitchfork (Inside)
Handle starts from Bar of A and price of (A+B)/2 and joins the base at C
Forks are drawn based on fib ratios from the handle
🎯 Modified Schiff Pitchfork (Inside)
Handle starts from mid of A and B and joins the base at C
Forks are drawn based on fib ratios from the handle
🎲 Brief about Pitchfork
The Angled Volume Profile technique expands on the concept of volume profile by measuring volume distribution levels over angled levels rather than just horizontal levels. By selecting a starting point and angle interactively, traders can assess volume distribution within specific price trends. This feature is particularly useful for analysing volume dynamics in trending markets.
🎲 Settings
Indicator settings include few things which determine the scanning of pitchforks and few which determines drawing of volume profile lines.
Please note that, due to pine limitations of 500 lines, if there are too many formations on the chart, volume profile may not appear correctly. If that happens, please reduce the number of volume forks per formation.

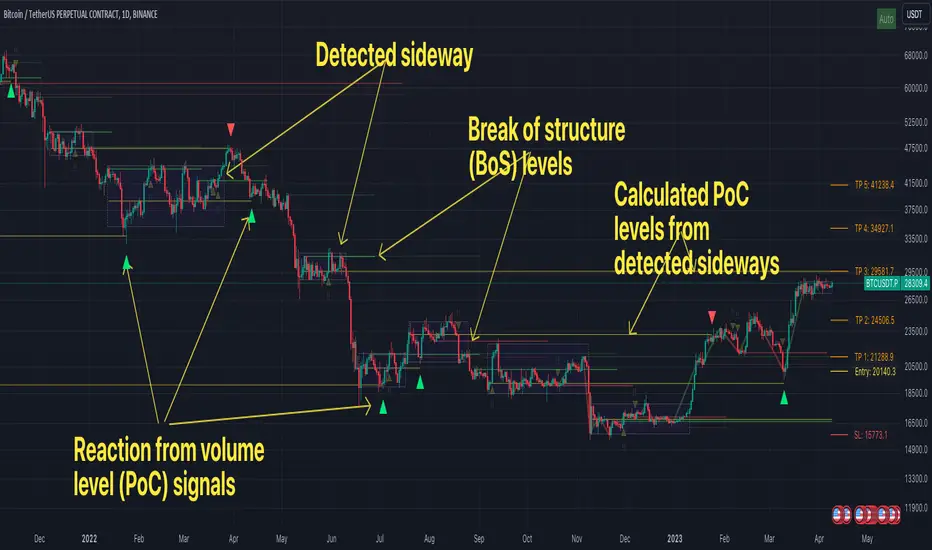
FFH Market structure v1The indicator determines the trend, its direction, confirmed trend, trend breakout levels (BoS), sideways ranges, volume profile point of control levels (vPoC) - all of this is conveniently displayed on the chart and helps complement your technical analysis.
The main idea of the script is to trade volume profile levels (vPoC) by identifying trends and sideways ranges. The script detect them and provides signals as soon as it detects a reaction from a volume level. You then complement these signals with your own technical analysis and make a decision to enter a trade. The script was developed solely to facilitate trading and address the issue of convenient visualization. Structure breakout levels are displayed as additional confirmations for making trading decisions. If we form a sideways range below/above such a trading level, it is a strong signal for me.
For sideways ranges, a volume level is calculated (vPoC), which also serves as input information for the signal engine. Signals are generated based on volume levels, with the calculation of stop loss (SL) and take profit (TP) levels. The SL is set at a certain percentage of the range boundaries or the previous high/low, as specified by a parameter. Targets are calculated intelligently based on trend reversal levels and volume levels.
The indicator parameters are individually tailored to each coin. The number of bars to determine the high/low is adjusted, as well as the allowable price deviation for defining the range boundaries on the first level. There are three modes for determining the sideways range, and data sources for highs/lows can be chosen (high/low/candle close, etc.). To make it more convenient for you to work with the indicator, there is an algorithm for automatic parameter adjustment built-in.
Currently script _only_ works for:
* BTC on 1-hour, 4-hour, and 1-day timeframes.
* ETC on 1-hour, 4-hour, and 1-day timeframes.
* Any altcoin on a 1-day timeframe.
The script will be beneficial to both novice traders, helping them understand market structure, sideways ranges, and identifying structure breakouts, as well as experienced traders, facilitating the process of plotting market structure elements on the chart and making trading decisions.
In any case, this script is not an investment idea.
All trading decisions you make based on the script are made independently and at your own risk.
Volume Orderbook (Expo)█ Overview
The Volume Orderbook indicator is a volume analysis tool that visually resembles an order book. It's used for displaying trading volume data in a way that may be easier to interpret or more intuitive for certain traders, especially those familiar with order book analysis.
This indicator aggregate and display the total trading volume at different price levels over the entire range of data available on the chart, similar to how an order book displays current buy and sell orders at different price levels. However, unlike a real-time order book, it only considers historical trading data, not current bid and ask orders. This provides a 'historical order book' of sorts, indicating where most trading activities have taken place.
Summary
This is a volume-based indicator that shows the volume traded at specific price levels, highlighting areas of high and low activity.
█ Calculations
The algorithm operates by calculating the cumulative volume traded in each specific price zone within the range of data displayed on the chart. The length of each horizontal bar corresponds to the total volume of trades that occurred within that particular price zone.
In essence, when the price is in a specific zone, the volume is added to the bar representing that zone. A thicker bar implies a larger price zone, meaning that more volume is accumulated within that bar. Therefore, the thickness of the bar visually indicates the amount of trading activity that took place within the associated price zone.
█ How to use
The Volume Orderbook indicator serves as a beneficial tool for traders by identifying key price levels with a significant amount of trading activity. These high-volume areas could represent potential support or resistance levels due to the large number of orders situated there. The indicator's ability to spotlight these zones might be particularly advantageous in pinpointing breakouts or breakdowns when prices move beyond these high-volume regions. Moreover, the indicator could also assist traders in recognizing anomalies, such as when an unusually large volume of trades occurs at unconventional price levels.
Identify Key Price Levels: The indicator highlights high-volume areas where a significant number of trades have occurred, which could act as potential support or resistance levels. This is based on the notion that many traders have established positions at these prices, so these levels may serve as significant areas for market activity in the future.
Volume Nodes: These are the peaks (high-volume areas) and troughs (low-volume areas) seen on the indicator. High-volume nodes represent price levels at which a large amount of volume has been traded, typically areas of strong support or resistance. Conversely, low-volume nodes, where very little volume has been traded, indicate price levels that traders have shown little interest in the past and could potentially act as barriers to price. It's important to note that while high trading volume can imply significant market interest, it doesn't always mean the price will stop or reverse at these levels. Sometimes, prices can quickly move through high-volume areas if there are no current orders (demand) to match with the new orders (supply).
Analyze Market Psychology: The distribution of volume across different price levels can provide insights into the market's psychology, revealing the balance of power between buyers and sellers.
Highlight Potential Reversal Points: The indicator can help identify price levels with high traded volume where the market might be more likely to reverse since these levels have previously attracted significant interest from traders.
Validate Breakouts or Breakdowns: If the price moves convincingly past a high-volume node, it could indicate a strong trend, suggesting a potential breakout or breakdown. Conversely, if the price struggles to move past a high-volume node, it could suggest that the trend is weak and might potentially reverse.
Trade Reversals: High-volume areas could also indicate potential turning points in the market. If the price reaches these levels and then starts to move away, it might suggest a possible price reversal.
Confirm Other Signals: As with all technical indicators, the "Volume Orderbook" should ideally be used in conjunction with other forms of technical and fundamental analysis to confirm signals and increase the odds of successful trades.
Summary
The Volume Orderbook indicator allows traders to identify key price levels, analyze market psychology, highlight potential reversal points, validate breakouts or breakdowns, confirm other trading signals, and anticipate possible trade reversals, thereby serving as a robust tool for trading analysis.
█ Settings
Source: The user can select the source, the default of which is "close." This implies that volume is added to the volume order book when the closing price falls within a specific zone. Users can modify this to any indicator present on their chart. For example, if it's set to an SMA (Simple Moving Average) of 20, the volume will be added to the volume order book when the SMA 20 falls within the specific zone.
Rows and width: These settings allow users to adjust the representation of volume order book zones. "ROWS" pertains to the number of volume order book zones displayed, while "WIDTH" refers to the breadth of each zone.
Table and Grid: These settings allow traders to customize the Volume order-book's position and appearance. By adjusting the "left" parameter, users can shift the position of the Volume order book on the chart; a higher value pushes the order book further to the right. Additionally, users can enable "Table Border" and "Table Grid" options to add gridlines or borders to the Volume order book for easier viewing and interpretation.
-----------------
Disclaimer
The information contained in my Scripts/Indicators/Ideas/Algos/Systems does not constitute financial advice or a solicitation to buy or sell any securities of any type. I will not accept liability for any loss or damage, including without limitation any loss of profit, which may arise directly or indirectly from the use of or reliance on such information.
All investments involve risk, and the past performance of a security, industry, sector, market, financial product, trading strategy, backtest, or individual's trading does not guarantee future results or returns. Investors are fully responsible for any investment decisions they make. Such decisions should be based solely on an evaluation of their financial circumstances, investment objectives, risk tolerance, and liquidity needs.
My Scripts/Indicators/Ideas/Algos/Systems are only for educational purposes!

MTF Evolving Weighted Composite Value Area🧾 Description:
This indicator calculates evolving value areas across 3 different timeframes/periods and combines them into one composite, multi-timeframe evolving value area - with each of the underlying timeframes' VAs assigned their own weighting/importance in the final calculation. Layered with extra smoothing options, this creates an informative and useful 'rolling value area' effect that can give you a better perspective on the value area across multiple periods at once as it develops - without total calculation resets at the onset of every new period.
Let's start with a simplified primer on value areas and then jump in to the new ideas this indicator introduces.
🤔 What is a value area?
Value areas are a tool used in market profile analysis to determine the range of prices that represents where most trading activity occurred during a specific time period, typically within a single 'bar' of a certain higher timeframe, such as the 4-hour, daily, or weekly. It helps traders understand the levels where the market finds value.
To calculate the value area, we look at the distribution of prices and trading volume. We determine a percentage, usually 70% or 80%, that represents the significant portion of trading volume. Then, we identify the price range that contains this percentage of trading volume, which becomes the value area.
Value areas are useful because they provide insights into market dynamics and potential support and resistance levels. They show where traders have been most active and where they find value, and traders can use this information to make better-informed decisions.
For example, if price is trading within the value area, it suggests that it's within a range where traders see value and are actively participating, which could indicate a balanced market. If the price moves above or below the value area, it may signal a potential shift in market sentiment or a breakout/breakdown from the established range.
By understanding the value area, traders can identify potential areas of supply and demand, determine levels of interest for buyers and sellers, and make decisions based on the market's perception of value.
📑 Limitations of traditional value areas
Static representation: Value areas are usually represented as static zones calculated after the fact. For example, after a daily period is completed, a typical 1D VA indicator will display the value area for the past period with static horizontal lines. This approach doesn't give you the power to see how the value area evolved, or developed, during the time period, as it is only displayed retroactively. It also doesn't give you the ability to view it as it evolves in real-time. This is why we chose to use an evolving value area representation, specifically borrowed from @sourcey's Value Area POC/VAH/VAL script function for calculating evolving VAs.
Rollover resets - no memory of past periods!: The traditional value area is calculated over a static period - it is calculated from the beginning of the period, for example a 1 day period, to the end, and that's the end of it. When the next daily period begins, the calculation resets, and has no memory of the preceding period. This limits the usefulness of the value area visual when viewed near the beginning of a new period before price and volume have been given ample time to define an area.
Hard to absorb all of that information: Value areas aren't generally meant to be a hardline representation of something extremely exact - they're based on a percentage of the area where traders appeared to find value over a certain time period. Most traders use them as a guide for support and resistance levels or finding an expected range. Traders typically overlay multiple VAs - sometimes requiring several instances of the same indicator to be applied - to represent the VA across multiple timeframes such as the 4H, 1D, or 1W. The chart quickly gets cluttered and it's not necessarily easy to understand the relationship between these multiple periods' VAs at a glance.
🧪 New concepts introduced in this indicator
With the evolving weighted composite value area we tried to address these limitations, and we think the result can be useful and intuitive for traders who want more dynamic and practical VAs for their everyday technical analysis.
⚖️ 1. A composite, weighted multi-timeframe VA
This indicator's value areas represent a combination or composite of the value areas calculated across multiple timeframes. The VAs calculated across each timeframe are then given a weighting percentage, which determines their contribution to the final 'weighted composite value area'.
Pictured below: a 4H/1D/1W MTF evolving weighted composite VA on the BTCUSDT Perpetual Futures (Binance) 5 minute chart:
Traditionally, when traders wanted to get a view of where the majority of trading activity occurred over the past four hours, day, and week, they would need to apply three value area indicators (or sometimes one if it allows multiple custom timeframes), each set to a different period (4H, 1D, 1W). The chart gets cluttered quickly and the information is hard to absorb in one shot. Addressing this problem was the main impetus for creating this weighted composite process.
〰️ 2. Rolling and smoothed evolving VAs
Because the composite VA is calculated based on multiple period VAs, there is no one single point where the area calculation resets (unless all 3 selected timeframes happen to rollover on the same bar). This creates a 'rolling' effect that gives a sense of the progression of the VA as price transitions through the different underlying time periods, without the traditional 'jump' in calculations between periods.
Pictured below: a 1D/1W/1M MTF evolving weighted composite VA on the NQ futures 1H chart:
To help give even more of a sense of perspective and 'progression' of the VA, there are also smoothing options to even out the 'jumps' at period-rollover points.
✔️ What's it good for?
Smoothed, rolling, and evolving multi-timeframe VAs that give you a better real-time perspective of where traders are finding value across multiple time periods at once.
📎 References
1. @sourcey's Value Area POC/VAH/VAL script by adapting its f_poc(tf) function.
💠 Features:
A MTF evolving weighted composite value area based on 3 underlying VAs calculated across customizable timeframes
Aesthetic and flexible coloring and color theme styling options
Period-roller labels and options for ease-of-use and legibility
⚙️ Settings:
Calculation Decimal Resolution: This setting essentially determines how 'granular' the value area calculating process is. This value should be set to some multiple of the tick size/smallest decimal of the symbol's price chart. Eg. On BTCUSDT, the tick size/decimal is usually 0.1. So, you might use 0.5. On TSLA, the tick size is 0.01. You might use 0.05 or 0.25. Beware: if the resolution is too small, calculation will take too long and the script may timeout.
Show Me Suggested Resolutions: If enabled, a label will display in the bottom right of the chart with some suggested resolutions for the current chart.
Area Percentage: Set the displayed percentage of the calculated composite value area. Igor method = 70%; Daniel method: 68%.
Use a Color Theme: When this setting is enabled, all manual 'Bullish and Bearish Colors' are overridden. All plots will use the colors from your selected Color Theme - excepting those plots set to use the 'Single Color' coloring method.
Color Theme: When 'Use a Color Theme' is enabled, this setting allows you to select the color theme you wish to use.
Resistance Color: When 'Use a Color Theme' is disabled, this will set the 'resistance color' for the composite VA.
Support Color: When 'Use a Color Theme' is disabled, this will set the 'support color' for the composite VA.
Show Period Rollover Labels: When enabled, a label will show above or below the composite VA marking any underlying period rollovers with the label 'New __' (eg. 'New 4H', 'New 1D', 'New 1W').
Size: Sets the font size of the period rollover labels.
Show Period Rollover Lines: When enabled, a translucent vertical dashed line will be drawn across the composite VA when one of the underlying periods rolls over.
Fill Composite Value Area: When enabled, the composite VA will be filled with a gradient coloring from the support line to the resistance line using their respective colors.
Smooth: When enabled, a smoothing moving average will be applied to the composite value area.
Smoothing Period: Set the lookback period for the smoothing average.
Smoothing Type: Set the calculation type for the smoothing average. Options include: Exponential, Simple, Weighted, Volume-Weighted, and Hull.
Enable: Include/exclude a timeframe's VA in the composite VA calculation.
Timeframe: Set the timeframe for this specific underlying VA.
Weighting %: Set the weighting percentage or 'importance' of this timeframe's value area in calculating the composite VA. Beware! The sum of the weighting percentages across all enabled timeframes must ALWAYS add up to 100 in order for this indicator to work as designed.

Volume Profile Bar-Magnified Order Blocks [MyTradingCoder]Introducing "Volume Profile Bar-Magnified Order Blocks", an innovative and unique trading indicator designed to provide traders with a comprehensive understanding of market dynamics. This tool takes the concept of identifying order blocks on your chart and elevates it by integrating a detailed volume profile within each order block zone.
Unlike standard order block indicators, Volume Profile Bar-Magnified Order Blocks pulls data from lower timeframe bars and assigns it to various segments of the order block. By providing this volume profile inside the order block, the indicator supplies a deeper, multi-dimensional view of market activity that can enhance your trading decisions.
Crucially, users have the ability to fine-tune the detection of order blocks. This is made possible through a single input setting called "Tuning". This integer value allows you to control the significance and frequency of the order blocks. Higher numbers will produce more significant order blocks, though they will appear less frequently. Lower numbers, on the other hand, will yield less significant order blocks, but they will occur more often. This enables you to adjust the sensitivity of the indicator according to your specific trading strategy and style.
Key Settings:
Number of Segments: Customize the level of detail in your volume profile by selecting the number of segments you want inside each order block.
Tuning: Adjust the sensitivity of order block detection to align with your trading strategy. Higher values produce more significant but less frequent order blocks, while lower values yield less significant but more frequent order blocks.
Color Inputs: Personalize the look of your chart by selecting the colors for various elements of the indicator. This ensures a seamless integration with your current chart aesthetics and improves visual clarity.
Here is a s creenshot that beautifully demonstrates the power of this indicator. You'll see how the price rejects perfectly off the highest volume segment in an order block, showcasing the indicator's potential for pinpointing high-impact price levels.
While Volume Profile Bar-Magnified Order Blocks offers many unique features, it should be used in conjunction with other indicators and forms of analysis for a complete trading strategy. As with all tools, it does not guarantee profitable trades but is intended to give traders more information to base their decisions on. Use it to complement your existing analysis and enhance your understanding of market behavior.
Experience a new level of clarity in your trading with Volume Profile Bar-Magnified Order Blocks - an indicator that goes beyond the surface to help you navigate the markets more effectively.
