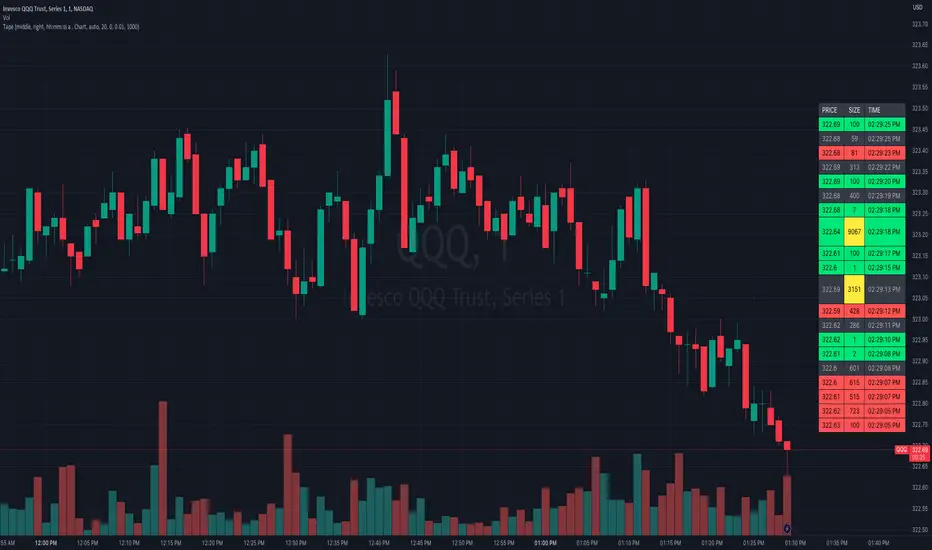
Tape (Time and Sales)OVERVIEW
This indicator is a synthesized "Tape" (aka. Time and Sales) from real time market data. It's specifically designed to be performant, expediting trading insights and decisions.
The table contains color-coded price action, volume size, and a timestamp data for each chart update. Because chart updates are independent of exchange orders, 1 chart update may combine more than 1 exchange and/or order. Even so, you're able to see very small and fast order flow changes, made possible by measuring real time volume differentials, and correlating them with price action.
Real time volume differentials are required for this indicator to be most useful. This is not ideal for historical analysis or TradingViews Replay feature.
INPUTS
You can can configure:
Table Position and Text Size
The Timestamp (visibility, format, timezone)
The number of lines to print
Volume Parameters (minimum size, large sizes, decimal precision)
Highlighting and Enlarging large sized prints
All the colors
DEV NOTES
This script illustrates:
The complimentary nature of loops and arrays
A method for iterative table management
Wskaźnik Pine Script®