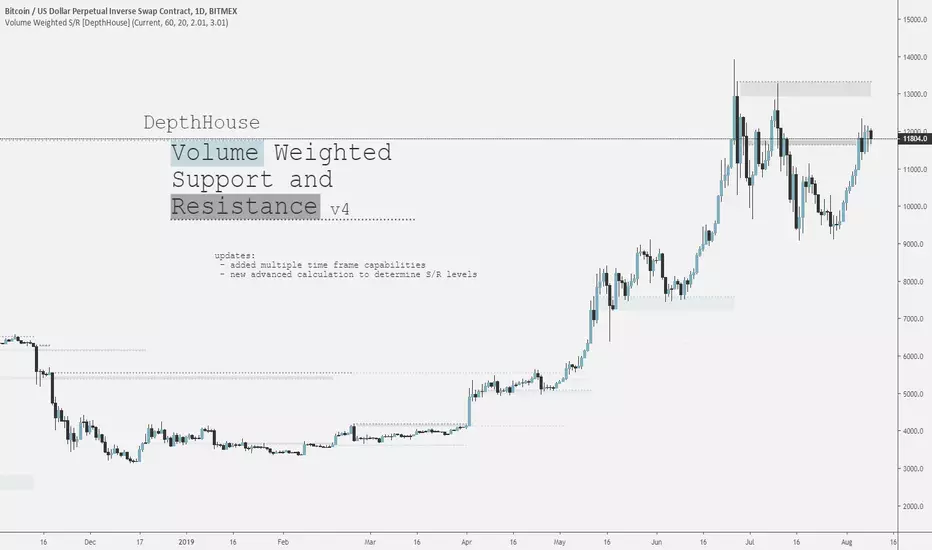
DepthHouse Volume Weighted Support and ResistanceDepthHouse Volume Weighted Support and Resistance or VWSP uses calculations based on volume to determine possible levels of support and resistance.
--Options--
Moving Average Type: The first version supports 4 different moving averages for which the calculation are based upon. SMA (default) EMA, TEMA, DEMA
more of these will be added based on popularity & requests
Factors: The Current version supports up to 3 different factors. This is what gives the VWSR the layering effect.
The defaults are 2,3,4. However please feel free to adjust these to match your trading style.
Fill Debugger: This does nothing other than alters the fill spacing. This is used to to get rid of continuous fills if they ever occur. Does not effect calculations at all.
Try this indicator for FREE! Just leave a comment, or feel free to send me a PM
Volitility
DepthHouse - Trend & Reversal CandlesticksDepth House Trend and Reversal Candlestick Indicato r is a custom trading tool designed to help traders determine trend direction, and possible trend reversal points.
Here is a video which I give a brief overview and show it in action:
youtu.be
How it works:
Based on the default settings, there are 5 primary colors that each have their own possible signal.
The colors are:
Green - Trending upwards
Red – Trending downwards
Lime –Trending upwards with a chance of reversal
Orange – Trending downwards with a chance of reversal
Grey – General trend is unknown
Please Note: There are NOT trading signals. Each colored candle represents nothing other than a possibility of which way the trend may go. Be sure to use your own adequate analysis. Use at your own financial risk.
How to get:
As you can see this is an invite only script. In the coming months this indicator, along with many others will become pay to use only. (website on my profile page)
However all my indicators will be FREE until May 1, 2018 . So please try them out!
To take advantage of this FREE trial:
1. Subscribe to my YouTube channel. I have many more videos to come! Maybe even leave a comment of what you would like to see next!
2. Comment on this indicator post! Maybe even give me a follow :D
I hope you all enjoy!!
Indicator website: depthhouse.com

DepthHouse - ATR BandsDepthHouse ATR Bands works very similar to the well-known Bollinger Bands.
However, these bands are calculated slightly different.
Instead of using the standard deviation formula, ATR Bands determines the size of the bands based on the average range.
How to use:
The bands tighten while the markets’ range becomes lower, and widens as its' range becomes broader. Giving the indicator a loaded spring effect.
A break outside of the bands in either direction usually indicates a breakout.
All 3 bands serve as possible support and/or resistance. Meaning breaks back into the bands could indicate a reversal, or end of the breakout.
This indicator is completely customizable, so compiling multiple sized bands on top of each other may create a strong competitive edge.
This indicator is free until January,1st 2018 – see how to get below
--
DepthHouse's ATR Bands is 1 of 3 indicators that will be available for purchase via subscription come Jan 2018.
This indicator package will come with the following 3 indicators:
:: MaxADX ::
::Premium oscillator to help spot forming trends and reversals.
:: MaxADX Signals ::
::Taking MaxADX a step farther by creating an overlay that show possible trend strengthening and reversals via bar colors and shapes.
:: ATRBands ::
::Like Bollinger Bands , this indicator is uses to help spot breakouts, and overbought/sold areas.
--
How to get:
To qualify for the trial period which ends January, 1st 2018, please go to the link on my profile and click subscribe!
You will then be sent directions for your account to be added to the whitelist.
If you have already subscribed to one of my previous indicators, you will be added to the list shortly
Likes and comments are so very much appreciated!

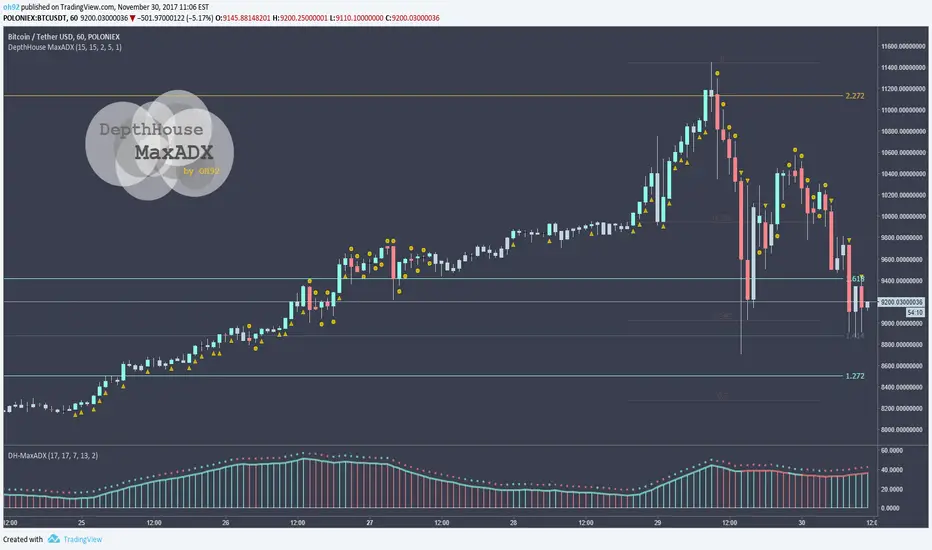
DepthHouse - MaxADX LayoverThis indicator takes our MaxADX a step further by giving possible trend change signals.
MaxADX combines directional information and smoothed moving averages to help traders indicate trend reversals and strengthening trends. As you can see in the chart above this indicator makes it very easy to spot trend reversals in trending markets.
How to use MaxADX Oscillator:
The top circles represent the immediate trend. Used as very early indication of trend changes and/or reversals
The solid line just below that represents the general trend direction. Green meaning up white red meaning down.
The histogram below that represents the general trend strength. A change in that indicate a reversal or a breakout in either direction.
The MaxADX Layover:
The layover then calculates three variables above, and determines the possible direction with symbols and/or bar colors which can easily be turned on or off.
Where this indicator falls short unfortunately, is its use in ranging markets.
Which leaves this as a great indicator for all beginners and professionals who prefer to trade in volatile markets such as cryptocurrencies.
This indicator will be free until January,1st 2018 – see how to get below
--
DepthHouse's MaxADX is 1 of 3 indicators that will be available for purchase via subscription come Jan 2018.
This indicator package will come with the following 3 indicators:
:: MaxADX ::
:: Premium oscillator to help spot forming trends and reversals.
:: MaxADX Signals ::
:: Taking MaxADX a step farther by creating an overlay that show possible trend strengthening and reversals via bar colors and shapes.
:: ATRBands ::
:: Like Bollinger Bands , this indicator is uses to help spot breakouts, and overbought/sold areas.
--
How to get:
To qualify for the trial period which ends January, 1st 2018, please go to the link in my bio and click subscribe!
You will then be sent directions for your account to be added to the whitelist.
If you have already subscribed, you will be added to the list shortly.