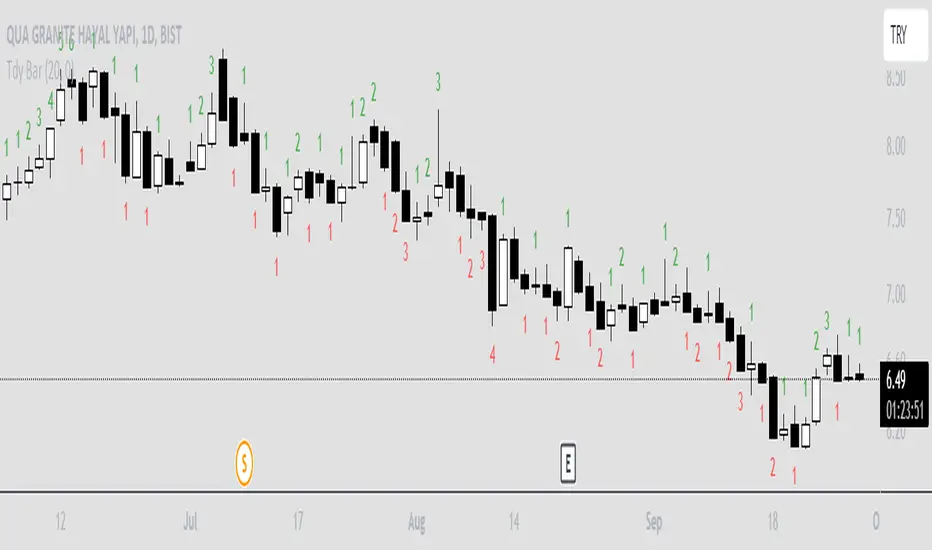
Trendy Bars CounterTrendy Bars Counter indicates the number of bars in trend.
Green: If trend is up
Red: If trend is down
Gray: If there is no trend
Minimum Number Of Trendy Bars: if trendy bars count is greater than this value trendy bars count will be plotted
Trendpattern
VWAP with CharacterizationThis indicator is a visual representation of the VWAP (Volume Weighted Average Price), it calculates the weighted average price based on trading volume. Essentially, it provides a measure of the average price at which an asset has traded during a given period, but with a particular focus on trading volume. In our case, the indicator calculates the VWAP for the current trading symbol, using a predefined simple moving average (SMA) with a period of 14. This volume-weighted moving average offers a clearer view of the behavior of the VWAP and, of consequence of market dynamics.
One of the distinctive features of this indicator is its ability to provide a more "linear" representation of the data. This means that the data is "smoothed" to remove noise, allowing you to more easily identify the direction of the market trend. This smoother representation is especially useful because the financial market can be subject to significant fluctuations and volatility, and this indicator can help get a more stable view of the trend.
The indicator also offers a visualization of the market trend in a very intuitive way. Using an evaluation of the highs and lows of the last 10 days, determine whether the market is in an uptrend, downtrend, or no trend at all. To make this evaluation even clearer and more immediate, the indicator line is colored dynamically. When the trend is bullish, the line is blue, while in case of a bearish trend, it takes on a distinctive color, such as pink. If the trend is not defined, the line will be colored differently, for example light yellow. This coloration gives traders an immediate visual indication of the prevailing trend, allowing them to make more informed decisions regarding trading operations.
One potential strategy involves watching candles when they cross the VWAP line strongly. If, for example, a candlestick breaks above the VWAP line, we may look for retest areas near key support levels to gauge a potential long entry. In other words, we would consider that the price may have the potential to rise further after breaking above the VWAP line, and we would look to enter a long position to take advantage of this opportunity.
On the other hand, if a candlestick crosses below the VWAP line, we might consider looking for retest areas near the VWAP line itself, which now serves as potential resistance. This could indicate a possible short entry opportunity, as the price may struggle to break above the resistance represented by the VWAP line after breaking it down. In this case, we would look to take advantage of the expected continuation of the downtrend.
In both cases, the idea is to exploit significant movements across the VWAP line as signals of potential reversal or continuation of the trend. This strategy can help identify key entry points based on price behavior relative to the VWAP line.

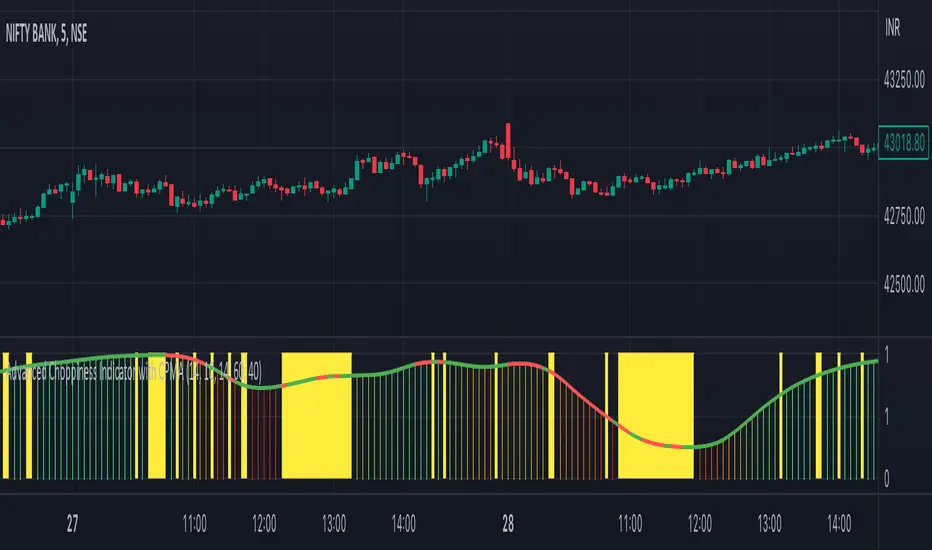
Advanced Choppiness Indicator with CPMA"The Advanced Choppiness Indicator with CPMA is a technical analysis tool designed to assist traders in identifying choppy market conditions and determining trend direction. It combines two key components: the Choppiness Index and a Custom Price Moving Average (CPMA).
The Choppiness Index is calculated using the Average True Range (ATR), which measures market volatility. It compares the ATR to the highest high and lowest low over a specified period. A higher Choppiness Index value indicates choppier market conditions, while a lower value suggests smoother and more directional price movements.
The CPMA is a custom moving average that takes into account various price types, including the close, high, low, and other combinations. It calculates the average of these price types over a specific length. The CPMA provides a smoother trend line that can help identify support and resistance levels more accurately than traditional moving averages.
When using this indicator, pay attention to the following elements:
Yellow range boxes: These indicate choppy zones, where market conditions are characterized by low momentum and erratic price action. Avoid entering trades during these periods.
Histogram bars: Green bars suggest an uptrend, while red bars indicate a downtrend. These bars are based on the CPMA and can help confirm the prevailing trend direction.
CPMA angle: The angle of the CPMA line provides further insight into the trend. A positive angle indicates an uptrend, while a negative angle suggests a downtrend.
Choppiness thresholds: The indicator includes user-defined thresholds for choppiness. Values above the high threshold indicate high choppiness, while values below the low threshold suggest low choppiness.
Trade decisions: Consider the information provided by the indicator to make informed trading decisions. Avoid trading during choppy zones and consider entering trades in the direction of the prevailing trend.
Remember that the indicator's parameters, such as ATR length and CPMA length, can be adjusted to suit your trading preferences and timeframe. However, it's important to use this indicator in conjunction with other technical analysis tools and your trading strategy for comprehensive market analysis."
By combining the Choppiness Index, CPMA, and other visual cues, this indicator aims to help traders identify suitable trading conditions and make more informed decisions based on market trends and volatility.
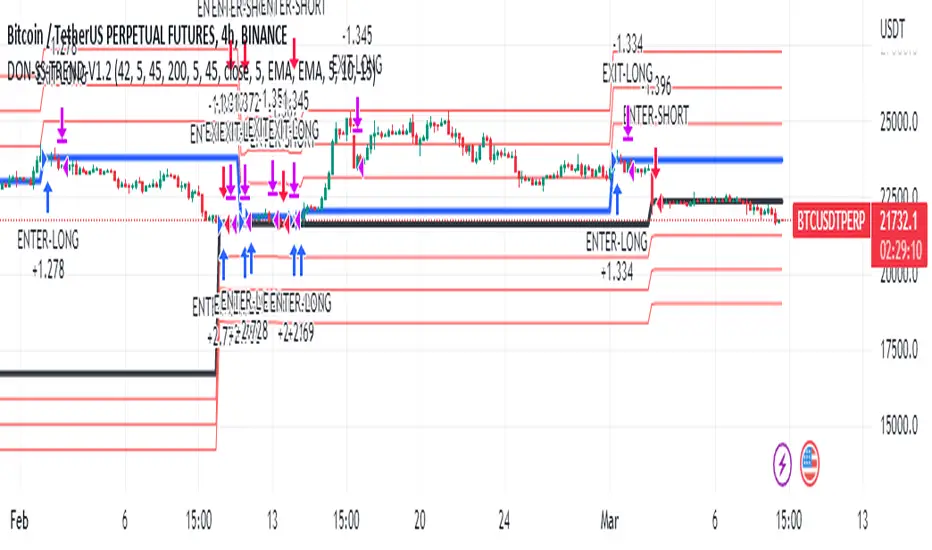
Donchian Trend V1The Donchian Trend strategy is a trend-following approach that uses the Donchian Channels indicator to identify potential entry and exit points in a security. The Donchian Channels are formed by taking the highest high and the lowest low prices over a specified period and plotting them as upper and lower channels around the current price. The width of the channels indicates the level of volatility in the market.
In this strategy, the Donchian Channels are used as a trend filter to determine the direction of the market. When the price is above the upper channel, it suggests an uptrend, and when the price is below the lower channel, it indicates a downtrend. The length of the Donchian Channels is a key parameter in the strategy, as it determines the look-back period for identifying the high and low prices.
Additional Logic: To further refine the entry and exit signals, The script uses two moving averages, a fast one (MA5) and a slow one (MA45), to identify trends and generate trading signals. When the fast moving average crosses above the slow moving average, a buy signal is generated, indicating that the market is trending upwards. Conversely, when the fast moving average crosses below the slow moving average, a sell signal is generated, indicating that the market is trending downwards.
Evaluation: The script was backtested on historical price data for the pair. The backtest results showed that the script was able to generate a net profit of , with a profit factor of and a Sharpe ratio of . The script also includes metrics such as the number of winning and losing trades, the average trade, and the largest winning and losing trades.
The strategy is evaluated based on its net profit, gross profit, gross loss, max run-up, max drawdown, buy & hold return, Sharpe ratio, Sortino ratio, and profit factor. The parameters used in the backtest include a Donchian Channel length of 42, which corresponds to a weekly time with divide of 4h time frame, and a short-term MA of 5 and a long-term MA of 45 for more accurate entry and exit signals.
Disclaimer: This script is for educational and research purposes only and should not be used for trading with real money without further testing and validation. Past performance is not indicative of future results.
Trend Analysis Ultimate (Zeiierman)█ Overview
Trend Analysis Ultimate (Zeiierman) highlights meaningful pullbacks within active market trends and visualizes them through green and red columns, retracement triangles, and an optional trend-colored background. It is designed to make the distinction between continuation and transition phases clear at a glance while automatically managing dynamic trailing stops, early and partial profit-taking levels, and alert conditions for entries, take-profits, and full exits.
The system adapts to changing market structure in real time, allowing traders to monitor momentum shifts, retracement strength, and phase transitions with precision. By combining structural mapping with adaptive sensitivity controls, it provides a complete framework for identifying where a trend is likely to continue, pause, or reverse.
⚪ Why This One Is Unique
Unlike traditional trend tools that simply color bars or measure moving averages, Trend Analysis Ultimate integrates retracement mapping with trend phase detection. Its framework merges contextual structure analysis (higher highs/lows or lower highs/lows) with dynamic sensitivity controls, identifying both the rhythm and the stress points within a trend.
Through a unified signal logic and adaptive retracement engine, traders can distinguish between normal pullbacks within a trend and retracements that precede reversal — all visualized with intuitive, color-coded accuracy.
█ Main features
⚪ Retracements
A retracement is a temporary move against the prevailing trend. It often signals a pause, potential continuation opportunity, or the early stages of a reversal. In this indicator, green/red retracement columns mark significant pullbacks that frequently precede new local highs/lows, continuation legs, or the end of a trend.
Key concept: Retracements appear at both continuation points and turning points. The trader’s edge is in recognizing whether the pullback is a reset of strength or the first warning that the current trend is losing control.
Bullish Retracement
Bearish Retracement
⚪ Retracements Signals
The Retracement Signals feature highlights the precise moments when a temporary counter-move within a dominant trend shows signs of exhaustion and potential continuation. It converts early momentum shifts into clear bullish or bearish setup signals.
Bullish Retracement Signal
Bearish Retracement Signal
⚪ Trend
The Trend Feature visually defines the current market regime — bullish, bearish, or neutral — by dynamically coloring bars, the indicator background, and the Confirmed Trend Columns in the lower panel. Together, these elements reflect the underlying directional bias detected by the trend engine, providing immediate context for all retracement, continuation, and entry signals.
Green bars, background, and confirmed columns → Active Bullish Trend Phase
Red bars, background, and confirmed columns → Active Bearish Trend Phase
Light or neutral bars → Transition Phase, signaling potential trend change or reduced directional strength.
█ How to Use
⚪ Major Retracements / Pullbacks
Major Bullish Retracements
Step 1: Ask Key Context Questions
When green retracement columns appear in the indicator window, ask yourself:
Are we in a bullish trend? Look for higher highs (HH) and higher lows (HL). Confirm that trendlines are pointing upward.
Is this forming a higher low? Green columns often print during pullbacks, just before price forms a higher low and the uptrend continues.
Is this a healthy correction? If price respects previous structure or the rising trendline, and the green bars begin shrinking, it indicates renewed strength and that the pullback may be ending.
Step 2: Apply Practically
If the answers above are Yes, the retracement likely represents a continuation opportunity.
Confirm an uptrend (HH/HL structure, rising trendlines).
Treat green columns as a pullback zone within that trend.
Watch for confirmation such as:
Rejection candles near support
Break of a short-term downtrend line
Volume confirming renewed buying pressure
Enter once price resumes upward movement, not during the retracement itself.
Major Bearish Retracements
Step 1: Ask Key Context Questions
When red retracement columns appear in the indicator window, ask yourself:
Are we in a bearish trend? Check if lower highs (LH) and lower lows (LL) are forming, and confirm that trendlines are pointing downward.
Is this forming a lower high? Red columns often appear during pullbacks, just before price forms a lower high and the downtrend resumes.
Is this a healthy correction? If price respects prior resistance or a falling trendline, and the red bars begin shrinking, it signals renewed weakness and that the pullback may be ending.
Step 2: Apply Practically
If the answers above are Yes, the retracement likely marks a continuation opportunity in the prevailing downtrend.
Confirm a downtrend (LH/LL structure, falling trendlines).
Treat red columns as a pullback zone within that trend.
Watch for confirmation such as:
Rejection candles near resistance
Break of a short-term uptrend line
Volume confirming renewed selling pressure
Enter once price resumes downward movement, not during the retracement itself.
⚪ Minor Retracements / Pullbacks
Minor retracements represent short, fast counter-moves within an active trend. They often occur as quick pauses or micro-corrections and are best suited for scalping or short-term continuation setups. Always align these signals with the dominant background trend and confirm direction using clear trendlines to stay on the right side of market structure.
Minor Bullish Retracements
When price is in a clear uptrend and a small pullback occurs:
Watch for short sequences of green retracement impulses (▲) or shrinking green columns on the indicator.
Treat these as quick buy-the-dip zones within the larger bullish context.
Look for confirmation from trendline support or a rejection candle before entering.
Minor Bearish Retracements
When price is trending downward and a brief rally appears:
Watch for red retracement impulses (▼) or shrinking red columns indicating weakening upward correction.
Use these as potential short re-entry zones in line with the broader downtrend.
Confirm with rejection at resistance or a break of a short-term uptrend line.
⚪ Retracements Signals
Bullish Signals
Bullish Retracement Signals appear during an active uptrend, typically within retracement phases when the market experiences a short-term pullback against the main trend. These signals are triggered when the retracement shows signs of exhaustion and the indicator detects renewed buying momentum aligned with the broader bullish structure.
They highlight potential continuation points, where the price may resume making higher highs after completing a healthy correction. This setup leverages the natural rhythm of the market — capturing the moment buyers regain control following temporary weakness.
Bearish Signals
Bearish Retracement Signals form during an active downtrend, typically within counter-trend rallies or retracement phases against the dominant bearish direction. They emerge when temporary upward movement loses strength, and the indicator identifies renewed selling pressure aligned with the main trend.
These signals often precede fresh downside continuation — when sellers reassert control and push price toward new lower lows.
⚪ Identifying the End of One Trend and the Start of Another
Every trend eventually runs out of strength. Early signs often look like a normal retracement, a routine pullback within the existing move. But when price fails to attract enough buyers or sellers to continue in the same direction, that retracement can mark the turning point where momentum shifts and a new trend begins.
When price can no longer find support in an uptrend or resistance in a downtrend, it signals exhaustion of the current phase and a possible transition into the opposite direction. The retracement columns highlight these transition zones, areas where one trend may fade and another may start forming.
When they appear, it’s important to ask:
Is the current trend mature? The longer a trend has been running, the greater the likelihood of reversal. If retracement columns show up late in a multi-leg move, treat them as early warnings.
Are there reversal signs forming? Watch for structures like double tops, double bottoms, trendline breaks, or channel violations that suggest the trend’s strength is fading.
By combining retracement columns with a clear understanding of trend structure and price action, traders can better distinguish between healthy pullbacks and the emergence of a new trend.
Bullish Trend Ends
Bearish Trend Ends
█ How It Works
⚪ Trend Phase Architecture
The indicator models directional bias through a continuously adaptive trend-mapping framework. It classifies market states as bullish, bearish, or neutral based on slope polarity and structural persistence.
Calculation: Utilizes layered regression vectors and dynamic range analysis to estimate directional gradients, blending short- and long-term components to maintain stability while remaining responsive to new motion.
⚪ Retracement Detection Engine
Retracement columns quantify counter-movements within the dominant trend, identifying deceleration, pullback depth, and phase overlap. Each bar’s classification reflects the relative strength trend progression.
Calculation: Applies trend-state comparison with phase-weighted averaging to isolate transitional motion. The resulting dual-polar columns (green/red) are normalized to a zero-centered scale for visual symmetry and precision.
⚪ Impulse & Triangle Module
Retracement impulses (▲/▼) represent local acceleration spikes during pullback phases, revealing the moment when opposing momentum reaches statistical significance.
Calculation: Identifies short-term impulse clusters through curvature mapping to isolate localized bursts of directional momentum within the retracement phase.
⚪ Entry & Signal Logic
The entry module fuses retracement data with trend-state validation, filtering signals through contextual structure and confirmation hierarchy. Only qualified impulses aligned with the dominant vector trigger actionable events.
Calculation: Integrates a composite decision function using multi-phase sensitivity weighting, differential smoothing, and state gating to separate impulsive noise from valid continuation momentum.
-----------------
Disclaimer
The content provided in my scripts, indicators, ideas, algorithms, and systems is for educational and informational purposes only. It does not constitute financial advice, investment recommendations, or a solicitation to buy or sell any financial instruments. I will not accept liability for any loss or damage, including without limitation any loss of profit, which may arise directly or indirectly from the use of or reliance on such information.
All investments involve risk, and the past performance of a security, industry, sector, market, financial product, trading strategy, backtest, or individual's trading does not guarantee future results or returns. Investors are fully responsible for any investment decisions they make. Such decisions should be based solely on an evaluation of their financial circumstances, investment objectives, risk tolerance, and liquidity needs.
Płatny skrypt

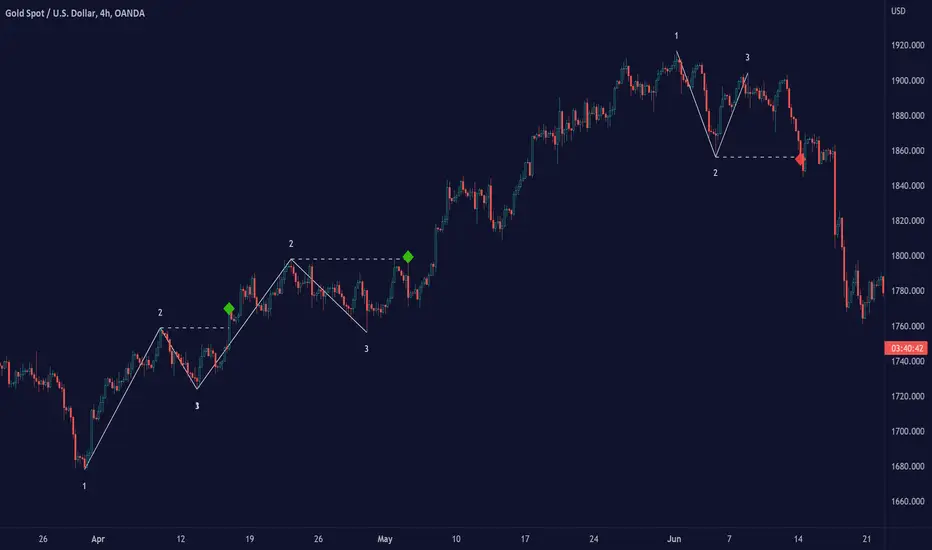
1-2-3 Pattern (Expo)█ Overview
The 1-2-3 pattern is the most basic and important formation in the market. Almost every great market move has started with this formation. That is why you must use this pattern to detect the next big trend. In fact, every trader has used the 1-2-3 formation to detect a trend change without realizing it.
Our 1-2-3 Pattern (Expo) indicator helps traders quickly identify the 1-2-3 Reversal Pattern automatically. By analyzing the price action data, the indicator shows the pattern in real-time. When the pattern is discovered, the 1-2-3 Pattern (Expo) Indicator notifies you via its built-in alert feature! Catching the upcoming big move can't be that much simpler.
█ How to use
The 1-2-3 pattern is used to spot trend reversals. The pattern indicates that a trend is coming to an end and a new one is forming.
-----------------
Disclaimer
The information contained in my Scripts/Indicators/Ideas/Algos/Systems does not constitute financial advice or a solicitation to buy or sell any securities of any type. I will not accept liability for any loss or damage, including without limitation any loss of profit, which may arise directly or indirectly from the use of or reliance on such information.
All investments involve risk, and the past performance of a security, industry, sector, market, financial product, trading strategy, backtest, or individual's trading does not guarantee future results or returns. Investors are fully responsible for any investment decisions they make. Such decisions should be based solely on an evaluation of their financial circumstances, investment objectives, risk tolerance, and liquidity needs.
My Scripts/Indicators/Ideas/Algos/Systems are only for educational purposes!
Waves Change SignalsAn extension (supporting script) for Waves series (e.g. Waves + ZOOnes). It detects candlestick patterns and:
supports merging few candles into one to get more sensitive candlestick patterns detection
supports filtering in the context of current wave (but it cannot draw the wave by itself)
It supports filtering based on 2 rulesets/wave variants:
Low - More sensitive (trend will change more ofter).
Meddium - Less sensitive ( trend will change less ofter).
Script with limited access, contact author to get authorization
Features:
- Detect candlestick formations
- Merge candles to detect hidden patterns
- Filter results with the current wave state (bullish signals for corrections, bearinsh signals for impulses) with use of Low or Medium waves.
- Limit results to last x patterns.
Script settings:
Trend type - You can switch what kind of waves should be used for filtering.
Limit - You can limit resutls to last X formations.
Include bar merges - You can pich which merge patters should be included. e.g. 3 2 2 means that 7 bars are merged into 3 with the sequence 3 bars as first, 2 bars as second, 2 bars as third.

Waves + ZOOnesTrend visualization tool in Wave theory. Unlike Elliot waves, it has a constant pattern length. The formation consists of impulse and 3 corrections.
The script analyzes candle relationships in the currect trend, trend will be continueted until candle are not breaking trend rules.
Currently it supports 2 rulesets/wave variants:
Low - More sensitive (trend will change more ofter).
Meddium - Less sensitive ( trend will change less ofter).
Simultaneous observation of both types allows to detect consolidation before the overlapping movement and increase the probability of indicating the moment of the movement occurrence.
Script with limited access, contact author to get authorization
Features:
- Show Low and Middle type/order waves
- Show support/resistance areas for the Low and Middle type/order waves.
- Types for waves and support areas are picked independently. Script can show Middle Waves with Low Waves support areas.
- Shadow mode that show second wave moved to the wave max/min bars.
- Show historical support/resistance areas that are not valid any more.
Script settings:
Trend type - You can switch what kind of waves should be drawn.
ImpulsMode - Picking graphical reprezentation of first bullish arrow.
Line width - With of drawn line. Separate setting for Low and Medium trend type.
Impuls - Color of the first bullish arrow.
Correction - Color for other arrows.
Trend shadow - Showing second reprezentation of the trend with drawing with the use of minimal and maximal values. It's usefull to determine the delay between the peak and a wave change signal.
ZOOnes type - Determines what type of trend is used to designate areas of support.
Only nearest zones - Drawing only one nearest zone above and below current price.
Only nearest potencial zones - Drawing only one nearest potencial zone above and below current price.
Show history - Showing zones in historical data
Zone precision - Determines how many bars are included in area calculation.
Alerts:
Low trend DOWN - When Low trend type is changing from UP to DOWN
Low trend UP - When Low trend type is changing from DOWN to UP
middle trend DOWN - When Middle trend type is changing from UP to DOWN
middle trend UP - When Middle trend type is changing from DOWN to UP
middle trend from ZOOnes DOWN - When Middle trend type is changing from UP to DOWN after hiting resistance area .
middle trend from ZOOnes UP = When Middle trend type is changing from DOWN to UP after hiting support area .
Troubleshooting:
In case of any problems, send error details to the author of the script.

Angel Algo PremiumAngel Algo provides a set of tools, combined into one solution. Each tool complements each other and is made to uniquely support your trading decisions for your daily trading tasks. You can immerse yourself into our customizable tools to create your own strategies using them.
With Angel Algo you can:
* Find trend direction using three different algorithms designed for trend following, swing and intraday traders.
* Determine market sentiment, overall trends and volume with our full custom dashboard.
* Get real-time support and resistance levels plotted automatically
* Get trend confirmation using one of the two custom candle coloring algorithms
Trading signals
We have 3 different algorithms for entry signals you can choose from
Regular Buy And Sell Signals
Our regular Buy And Sell Signals are finding optimal times to enter for any security. This algorithm uses our original trend filter based on market volatility that adapts to different assets and market conditions.
We give traders the ability to adjust the sensitivity and aggression of these signals to market price changes, as well as the option to make them less sensitive to ranging markets so you can adjust to any market.
We added Auto Best Settings toggle to automatically optimize the settings for you if you'd like.
By adjusting the sensitivity and aggression parameters you can adopt the signal algorithm to different trading styles. For trend following which tries to capitalize on longer trends you should make the signals to be less frequent by adjusting this parameters. The settings that lead to more frequent signals suit to swing trading style.
Strong Signals Algorithm
The Strong Signals use an algorithm based on trend filtering coupled with confirmation signal based on higher time frame trend direction. It finds "Strong" buy or sells that are a tad different from the regular buy & sell signals you will see, a lot of the time they land on top of each other which can be used as an extra confirmation tool. Traders can also use this as a stand alone on higher timeframes.
Angel Intraday algorithm
We constantly try to push Pine script to its limits developing new features. Angel Intraday is our machine learning algorithm in beta that scans for intraday contrarian signals.
To find entry points it forecasts price range for a trading session using linear regression analysis and Kalman filtering.
If an asset is trading 24 hours a day it works with 12 hour sessions, for stocks it forecasts a price range for 7 hour trading sessions which represent the full trading day.
You can use this algorithm to get intraday trading signals for any asset. One of the advantages of this algorithm is that it gives identical signals for all intraday timeframes. The optimal time frames to view the signals and to enter positions are any.
What is the information in our Dashboard?
We offer real-time dashboard showing useful information to analyze market conditions:
- Angel Algo Trend Detection
- Directional Movement
- Angel Cloud for moving average detection
- Relative Volume
- Overall Market Sentiment
All of this information is aimed to help traders understand when the market regime is changing. The first three features help you to judge about trend strength. Relative volume shows current activity of market participants. Overall market sentiment reflects the actual bias for market direction.
Trend weakness, low market activity and neutral sentiment are the signs that can help you in early detecting of ranging market and avoid false trend signals or switch to contrarian mode.
The tools provided by Angel Algo are designed to help you perform rational actions based on the market data in a systematic way and to reduce emotional factor in your trading.
Using this script, please, keep in mind that that past performance does not necessarily represent future results and that there are trading.

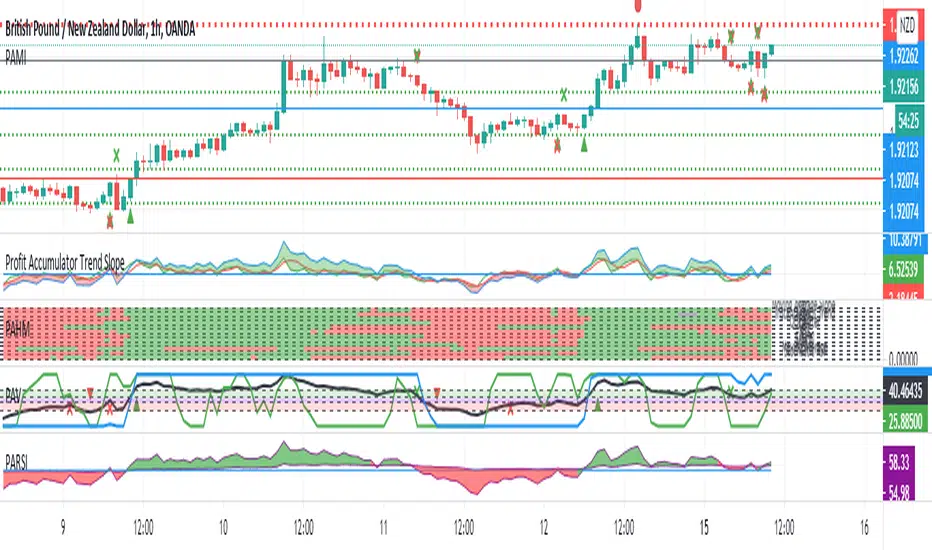
Profit Accumulator Trend SlopeI've been getting very good results with this indicator, using it in conjunction with the Profit Accumulator Main Indicator.
This indicator uses a number of methods for detecting reversals and the start of new trends.
The basis is simple in that when the trend lines cross above the zero line, it indicates a possible long entry and crossing below the zero line, indicates a possible short entry.
The strongest signal is when they all cross the zero line in one timeframe.
In terms of options/settings, I've included the following:
Multiple Timeframe
Changing the lengths.
I've also added an alert option for when the lines cross the zero line.
Extremes (Expo) Extremes (Expo)
DESCRIPTION
This Extreme (Expo) indicator identifies areas where the market is extreme. The length of the extreme calculation can be changed and gives you the flexibility to choose how sensitive the indicator should be. A longer length means that the indicator only identifies bold extremes. A shorter length is more sensitive and thus identifies all extremes in the market.
When the market is in an extreme mode, keep your trade until the extreme mode ends.
Postive extreme is when the price is above the positive extreme lines. (Keep your long trade until the positive extreme ends).
Negative extreme is when the price is below the negative extreme lines. (Keep your short trade until the negative extreme ends).
The Extremes (Expo) can be used to visualize the trend. Price crossing indicates a directional change. Price can also bounce off the extremes lines, which can act as dynamic support and resistance. It is often used in combination with other signals and analysis techniques.
TREND
The indictor has a Trend- feature that can be switched on which identifies trend shifts as well as trend direction.
A positive trend is when all three trendlines are green, and when the price is at least above one of these three lines.
A Negative trend is when all three trendlines are red, and when the price is at least under one of these three lines.
When the color of the trend lines changes color it indicates that the trend might shift direction. When all three trendlines have shifted color a trend is established.
PULLBACK
A bonus feature that is added to the trend-setting is that it can detect pullbacks in trends. This is visualized by that one of the three trendlines change color. For instance, say that all 3 lines are red (negative trend) and one of these lines changes color to green it can be regarded as a pullback in the negative trend.
HOW TO USE
1. Use the indicator to identify extreme areas.
2. Use the indicator to identify trends.
3. Use the indicator to identify trend shifts.
4. Use the indicator to identify pullbacks in trends.
INDICATOR IN ACTION
EXTREMES
BTCUSD
BTCUSD
TESLA
WALL STREET
TREND & PULLBACK
WALL STREET
EURUSD
I hope you find this indicator useful , and please comment or contact me if you like the script or have any questions/suggestions for future improvements. Thanks!
I will continue to work on this indicator, so please share your experience and feedback with me so that I can continuously improve it. Thanks to everyone that have contacted me regarding my scripts. Your feedback is valuable for future developments!
ACCESS THE INDICATOR
• Contact me on TradingView or use the links below
-----------------
Disclaimer
Copyright by Zeiierman.
The information contained in my scripts/indicators/ideas does not constitute financial advice or a solicitation to buy or sell any securities of any type. I will not accept liability for any loss or damage, including without limitation any loss of profit, which may arise directly or indirectly from use of or reliance on such information.
All investments involve risk, and the past performance of a security, industry, sector, market, financial product, trading strategy, or individual’s trading does not guarantee future results or returns. Investors are fully responsible for any investment decisions they make. Such decisions should be based solely on an evaluation of their financial circumstances, investment objectives, risk tolerance, and liquidity needs.
My scripts/indicators/ideas are only for educational purposes!

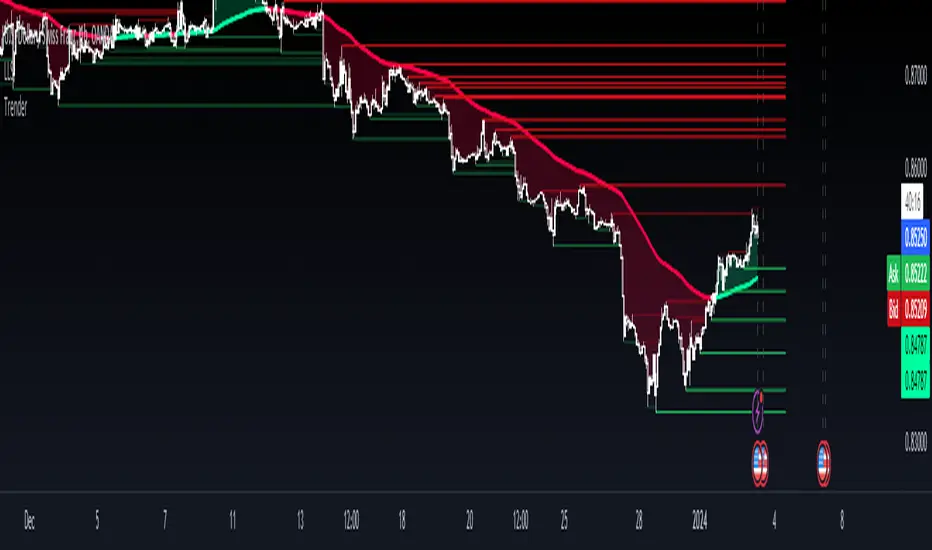
TrenderTrender is an indicator that compiles trend-following ideas in a complete friendly-custom indicator. Based on classic arithmetic moving averages, exponential moving averages, volume and a little bit of Fibonacci. Indicator built and usable in TradingView, focused only for easy visualization of the trend.
Auto Trend Lines [Anan]Hello Friends..
This is Auto Trend Lines, A script that draws trendlines from the pivot points in the price chart,,
So helpful and smart !
Play with the options to adjust the precision.
This is my simple edition from " Trendlines - JD "
