Advanced Multi-Level S/R ZonesAdvanced Multi-Level S/R Zones: The Comprehensive Guide
1. Introduction: The Evolution of Support & Resistance:
Support and Resistance (S/R) is the backbone of technical analysis. However, traditional methods of drawing these levels are often plagued by subjectivity. Two traders looking at the same chart will often draw two different lines. Furthermore, standard indicators often treat every price point equally, ignoring the critical context of Volume and Time.
The Advanced Multi-Level S/R Zones script represents a paradigm shift. It moves away from subjective line drawing and toward Quantitative Zoning. By utilizing statistical measures of variability (Standard Deviation, MAD, IQR) combined with Volume-Weighting and Time-Decay algorithms, this tool identifies where price is mathematically most likely to react. It treats S/R not as thin lines, but as dynamic zones of probability.
2. Core Logic and Mathematical Foundation:
To understand how to use this tool optimally, one must understand the "engine" under the hood. The script operates on four distinct pillars of logic:
A. Session-Based Data Collection:
The script does not look at every single tick. Instead, it aggregates data into "Sessions" (daily bars by default logic). It extracts the High, Low, and Total Volume for every session within the user-defined lookback period. This filters out intraday noise and focuses on the macro structure of the market.
B. Adaptive Statistical Variability:
Most Bollinger Band-style indicators use Standard Deviation (StdDev) to measure width. However, StdDev is heavily influenced by outliers (extreme wicks). This script offers a sophisticated Adaptive Method-Skewness Detection: The script calculates the skewness of the price distribution. Adaptive Selection: If the data is highly skewed (lots of outliers, typical in Crypto), it switches to MAD (Median Absolute Deviation). MAD is robust and ignores outliers. If the data is moderately skewed, it uses IQR (Interquartile Range). If the data is normal (Gaussian), it uses StdDev.
Benefit: This ensures the zone widths are accurate regardless of whether you are trading a stable Forex pair or a volatile Altcoin.
C. The Weighting Engine (Volume + Time)
Not all price history is equal. This script assigns a "Weight Score" to every session based on two factors:
Volume Weighting: Sessions with massive volume (institutional activity) are given higher importance. A high formed on low volume is less significant than a high formed on peak volume.
Time Decay: Recent price action is more relevant than price action from 50 bars ago. The script applies a decay factor (default 0.85). This means a session from yesterday has 100% impact, while a session from 10 days ago has significantly less influence on the zone calculation.
D. Clustering Algorithm
Once the data is weighted, the script runs a clustering algorithm. It looks for price levels where multiple session Highs (for Resistance) or Lows (for Support) congregate.
It requires a minimum number of points to form a zone (User Input: minPoints).
It merges nearby levels based on the Cluster Separation Factor.
This results in "Primary," "Secondary," and "Tertiary" zones based on the strength and quantity of data points in that cluster.
3. Detailed Features and Inputs Breakdown:
Group 1: Main Settings
Lookback Sessions (Default: 10): Defines how far back the script looks for pivots. A higher number (e.g., 50) creates long-term structural zones. A lower number (e.g., 5) creates short-term scalping zones.
Variability Method (Adaptive): As described above, leave this on "Adaptive" for the best results across different assets.
Zone Width Multiplier (Default: 0.75): Controls the vertical thickness of the zones. Increase this to 1.0 or 1.5 for highly volatile assets to ensure you catch the wicks.
Minimum Points per Zone: The strictness filter. If set to 3, a price level must be hit 3 times within the lookback to generate a zone. Higher numbers = fewer, but stronger zones.
Group 2: Weighting
Volume-Weighted Zones: Crucial for identifying "Smart Money" levels. Keep this TRUE.
Time Decay: Ensures the zones update dynamically. If price moves away from a level for a long time, the zone will fade in significance.
ATR-Normalized Zone Width: This is a dynamic volatility filter. If TRUE, the zone width expands and contracts based on the Average True Range. This is vital for maintaining accuracy during market breakouts or crashes.
Group 3: Zone Strength & Scoring
The script calculates a "Score" (0-100%) for every zone based on:
-Point Count: More hits = higher score.
-Touches: How many times price wicked into the zone recently.
-Intact Status: Has the zone been broken?
-Weight: Volume/Time weight of the constituent points.
-Track Zone Touches: Looks back n bars to see how often price respected this level.
-Touch Threshold: The sensitivity for counting a "touch."
Group 4: Visuals & Display
Extend Bars: How far to the right the boxes are drawn.
Show Labels: Displays the Score, Tier (Primary/Secondary), and Status (Retesting).
Detect Pivot Zones (Overlap): This is a killer feature. It detects where a Support Zone overlaps with a Resistance Zone.
Significance: These are "Flip Zones" (Old Resistance becomes New Support). They are colored differently (Orange by default) and represent high-probability entry areas.
Group 5: Signals & Alerts
Entry Signals: Plots Buy/Sell labels when price rejects a zone.
Detect Break & Retest: specifically looks for the "Break -> Pullback -> Bounce" pattern, labeled as "RETEST BUY/SELL".
Proximity Alert: Triggers when price gets within x% of a zone.
4. Understanding the Visuals (Interpreting the Chart)
When you load the script, you will see several visual elements. Here is how to read them:
The Boxes (Zones)
Red Shades: Resistance Zones.
Dark Red (Solid Border): Primary Resistance. The strongest wall.
Lighter Red (Dashed Border): Secondary/Tertiary. Weaker, but still relevant.
Green Shades: Support Zones.
Dark Green (Solid Border): Primary Support. The strongest floor.
Orange Boxes: Pivot Zones. These are areas where price has historically reacted as both support and resistance. These are the "Line in the Sand" for trend direction.
The Labels & Emojis
The script assigns emojis to zone strength:
🔥 (Fire): Score > 80%. A massive level. Expect a strong reaction.
⭐ (Star): Score > 60%. A solid structural level.
✓ (Check): Score > 40%. A standard level.
"⟳ RETESTING": Appears when a zone was broken, and price is currently pulling back to test it from the other side.
The Dashboard (Top Right)
A statistics table provides a "Head-Up Display" for the asset:
High/Low σ (Sigma): The variability of the highs and lows. If High σ is much larger than Low σ, it implies the tops are erratic (wicks) while bottoms are clean (flat).
Method: Shows which statistical method the Adaptive engine selected (e.g., "MAD (auto)").
ATR: Current volatility value used for normalization.
5. Strategies for Optimum Output
To get the most out of this script, you should not just blindly follow the lines. Use these specific strategies:
Strategy A: The "Zone Fade" (Range Trading)
This works best in sideways markets.
Identify a Primary Support (Green) and Primary Resistance (Red).
Wait for price to enter the zone.
Look for the "SUPPORT BOUNCE" or "RESISTANCE REJECTION" signal label.
Entry: Enter against the zone (Buy at support, Sell at resistance).
Stop Loss: Place just outside the zone width. Because the zones are calculated using volatility stats, a break of the zone usually means the trade is invalid.
Strategy B: The "Pivot Flip" (Trend Following)
This is the highest probability setup in trending markets.
Look for an Orange Pivot Zone.
Wait for price to break through a Resistance Zone cleanly.
Wait for the price to return to that zone (which may now turn Orange or act as Support).
Look for the "RETEST BUY" label.
Logic: Old resistance becoming new support is a classic sign of trend continuation. The script automates the detection of this exact geometric phenomenon.
Strategy C: The Volatility Squeeze
Look at the Dashboard. Compare High σ and Low σ.
If the values are dropping rapidly or becoming very small, the zones will contract (become narrow).
Narrow zones indicate a "Squeeze" or compression in price.
Prepare for a violent breakout. Do not fade (trade against) narrow zones; look to trade the breakout.
6. Optimization & Customization Guide
Different markets require different settings. Here is how to tune the script:
For Crypto & Volatile Stocks (Tesla, Nvidia)
Method: Set to Adaptive (Mandatory, as these assets have "Fat Tails").
Multiplier: Increase to 1.0 - 1.25. Crypto wicks are deep; you need wider zones to avoid getting stopped out prematurely.
Lookback: 20-30 sessions. Crypto has a long memory; short lookbacks generate too much noise.
For Forex (EURUSD, GBPJPY)
Method: You can force StdDev or IQR. Forex is more mean-reverting and Gaussian.
Multiplier: Decrease to 0.5 - 0.75. Forex levels are often very precise to the pip.
Volume Weighting: You may turn this OFF for Forex if your broker's volume data is unreliable (since Forex has no centralized volume), though tick volume often works fine.
For Scalping (1m - 15m Timeframes)
Lookback: Decrease to 5-10. You only care about the immediate session history.
Decay Factor: Decrease to 0.5. You want the script to forget about yesterday's price action very quickly.
Touch Lookback: Decrease to 20 bars.
For Swing Trading (4H - Daily Timeframes)
Lookback: Increase to 50.
Decay Factor: Increase to 0.95. Structural levels from weeks ago are still highly relevant.
Min Points: Increase to 3 or 4. Only show levels that have been tested multiple times.
7. Advantages Over Standard Tools:
Feature Standard S/R Indicator, Advanced Multi-Level S/R Calculation, Uses simple Pivots or Fractals, Uses Statistical Distributions (MAD/IQR). Zone Width Arbitrary or Fixed Adaptive based on Volatility & ATR.
Context Ignores Volume Volume Weighted (Smart Money tracking).
Time Relevance Old levels = New levels Time Decay (Recency bias applied).
Overlaps Usually ignores overlaps Detects Pivot Zones (Res/Sup Flip).
Scoring None 0-100% Strength Score per zone.
8. Conclusion:
The Advanced Multi-Level S/R Zones script is not just a drawing tool; it is a statistical analysis engine. By accounting for the skewness of data, the volume behind the moves, and the decay of time, it provides a strictly objective roadmap of the market structure.
For the optimum output, combine the Pivot Zone identification with the Retest Signals. This aligns you with the underlying flow of order blocks and prevents trading against the statistical probabilities of the market.
Analizy Trendu

ZeroDegen Mega Pro Pack v2═══════════════════════════════════════════════════════════════════════════════
ZERODEGEN MEGA PRO PACK v2 — Multi-Mode Trading System
═══════════════════════════════════════════════════════════════════════════════
Professional trading indicator with 11 modes for crypto markets. Clear BUY/SELL signals, real-time market analysis, and institutional-grade filters.
🎯 WHAT IT DOES
Analyzes price action using multi-factor confirmation:
- EMA crossovers (9/21) for trend direction
- RSI momentum filtering
- ADX trend strength validation
- Volume confirmation
- Higher timeframe bias (1H trend filter)
- Institutional concepts: Liquidity sweeps, Fair Value Gaps
Generates clear BUY and SELL signals directly on your chart with a real-time status panel showing all market conditions at a glance.
📊 11 TRADING MODES
SCALP (15m): Standard, Aggressive, Conservative
TREND (1H-4H): Standard, Cloud, Institutional
INSTITUTIONAL: Liquidity Engine
MIXED: Pro, Reversal, Auto Engine, Automation + Confidence
Switch modes with one click to match market conditions.
⚡ KEY FEATURES
✓ Clear visual BUY/SELL/EXIT signals
✓ Real-time status panel with all indicators
✓ Smart filters (Volume, ADX, ATR, Range)
✓ HTF Bias display (1H trend direction)
✓ Institutional Confidence score
✓ Works on any crypto pair
✓ TradingView alert-ready
📈 RECOMMENDED USAGE
Timeframes: 15m (scalp), 1H (swing), 4H (trend)
Markets: BTC, ETH, SOL, and other liquid crypto pairs
🔐 HOW TO GET ACCESS
Visit: xeroc00l.org
- Monthly: $59/mo
- Quarterly: $149 (save 15%)
- Lifetime: $497 (one-time)
After payment, send your TradingView username to zerocool@xeroc00l.org — access granted within 24 hours.
🚀 COMING SOON
We're actively developing additional features including bot integration, automated execution, and a private trading community. Subscribe now and get access to all future updates.
Learn more: xeroc00l.org
⚠️ LEGAL DISCLAIMER
This indicator is provided for educational and entertainment purposes only. It is not financial advice and should not be construed as a recommendation to buy, sell, or hold any cryptocurrency or financial instrument.
Trading cryptocurrencies and leveraged products involves substantial risk of loss and is not suitable for all investors. Past performance is not indicative of future results. You should not trade with money you cannot afford to lose.
The creators of ZeroDegen are not licensed financial advisors, brokers, or dealers. By using this indicator, you acknowledge that all trading decisions are your own responsibility and you agree that ZeroDegen and its creators are not liable for any losses incurred.
Always do your own research and consider consulting a licensed financial professional before making investment decisions.
© 2025 ZeroDegen | For entertainment purposes only

Impulsive Trend Detector [dtAlgo]This advanced Pine Script indicator identifies and tracks impulsive price movements based on Break of Structure (BOS) and Change of Character (CHoCH) concepts from Smart Money trading methodology.
The indicator automatically detects pivot highs and lows, then monitors when price breaks these key levels to signal potential impulsive moves. BOS indicates continuation in the current trend direction, while CHoCH signals potential trend reversals. Each detected move is measured from the break point to the next opposing pivot, providing accurate percentage calculations that match TradingView's measuring tool.
Impulsive moves are categorized into four levels based on magnitude (Level 1: 5-10%, Level 2: 10-15%, Level 3: 15-20%, Level 4: 20%+), with color-coded visual labels and connecting lines displayed directly on the chart.
Comprehensive Session Analysis:
Track moves across 11 distinct trading sessions in Eastern Time: Pre-London/NY, London/NY overlap, NY (with Power Hour and End subdivisions), Sydney, Asia, Sake Time, Asia/London overlap, London, Weekend, and No Session periods.
Three Dynamic Tables provide:
Real-time statistics (bullish/bearish, BOS/CHoCH, levels)
Session breakdown with move counts and average percentages
Event log showing last 10 moves with date, day, session, direction, type, level, percentage, duration, and bar count
Perfect for Smart Money traders seeking data-driven insights into market structure behavior across global trading sessions.

Trend Targets [Philosopher] Pro Alerts & Live DashTrend Targets Pro: Advanced Trend Analysis & Live Risk Management
Trend Targets Pro is a comprehensive trend-following ecosystem designed for traders who demand precision, automated risk management, and real-time performance tracking. By merging multi-layered trend filtering with dynamic volatility-based targets, this tool transforms complex price action into a clear, actionable roadmap.
Core Methodology
The script utilizes a unique "Dual-Filter" logic to identify high-probability trend shifts:
The Baseline: A sophisticated combination of Supertrend logic smoothed by WMA (Weighted Moving Average) and EMA (Exponential Moving Average). This creates a "Trend Baseline" that filters out market noise and identifies the true directional bias.
Confirmation Rejections: The script tracks price "rejections" against the baseline. Only after a user-defined confirmation count is met does the script signal a continuation, ensuring you aren't entering on minor fluctuations.
Key Features
🚀 Automated Trade Architecture: Upon a trend shift (Bullish/Bearish), the script instantly calculates and draws an Entry Line, an ATR-based Stop Loss, and three tiered Take Profit levels (TP1, TP2, TP3).
📊 Live Performance Dashboard: Track your current session in real-time. The on-chart HUD displays Total Trades, Profitable Trades, and Lost Trades, giving you immediate feedback on the current market's compatibility with the strategy.
🎯 Dynamic Visual Feedback:
Trend-Colored Bars: The entire chart atmosphere adapts to the trend.
Live Labels: Targets dynamically update and change color (Green/Red) when hit, providing "at-a-glance" trade management.
Rejection Signals: Visual triangle markers (▲/▼) indicate potential continuation points within an existing trend.
🔔 Institutional-Grade Alert System:
Entry Alerts: Includes Entry, SL, and all 3 TP prices.
Execution Alerts: Instant notifications when any TP or SL is triggered.
Weekly Reports: Automatically generates a performance summary every Saturday to help you review your weekly net points.
Asset-Specific UI: Built-in emoji support for Gold (XAU), BTC, Forex, and Indices for better readability in Telegram/Discord webhooks.
Risk Management at its Core
The script is built for professional risk-to-reward ratios. By using ATR (Average True Range) for target calculation, the "Philosopher" edition ensures your stops and targets are mathematically proportional to the current market volatility.
Risk Warning included in alerts: "Trading involves high risk. Secure your trade at TP1 and maintain strict risk management."
How to Use
Trend Detection: Wait for a color change in the Baseline or a Plotshape label.
Execution: Use the calculated TP/SL levels provided by the dynamic labels.
Optimization: Adjust the "Supertrend Factor" for higher timeframes and the "Confirmation Count" to filter out choppy markets.
Technical Specifications:
Version: Pine Script™ v6 (Latest)
Overlay: Enabled
Alerts: Fully dynamic (supports placeholders)
Disclaimer
This indicator is for educational and informational purposes only. Past performance does not guarantee future results. Always trade within your risk limits.

Delta Pressure SpectrumWhat this indicator is (brief)
Delta Pressure Spectrum (DPS-3) is a volume-pressure oscillator that estimates buy vs sell imbalance (a delta proxy), then normalizes it into a robust z-score so “significant” pressure means the same thing across different volatility regimes and market conditions. It visualizes that pressure as delta candles + a histogram, and only “lights up” with three breach tiers (plus an ultra-rare white core) when the move is statistically extreme for the current environment.
How to use it:
1) Read it like a pressure gauge, not an entry signal
-Histogram/candle height = intensity of net pressure (buy-dominant vs sell-dominant).
It’s best at telling you: “Is this move real pressure or just price wiggling?”
2) The 3 tiers tell you “how abnormal” the pressure is
-Tier-1 (weak breach): meaningful but common; “something’s happening.”
-Tier-2 (strong breach): rare enough to care; often aligns with real expansions / squeezes / liquidation events.
-Tier-3 (extreme breach): statistically extreme; often shows climactic behavior (either continuation impulse or blow-off/flush conditions).
-White core: only when Tier-3 overshoots hard—treat as “exceptional event.”
Key idea: tiers are adaptive. Tier-2 on BTC 1m and Tier-2 on ES 1h should both represent “strong for that regime.”
3) Best ways to trade with it (high-signal)
-Trend continuation confirmation: In an uptrend, repeated Tier-2/Tier-3 on the up side = real demand; avoid fading unless structure breaks.
-Exhaustion / climax watch: Tier-3 + white core after an extended run = “crowded pressure.” That can precede either: continuation (if structure holds), or reversal / mean reversion (if structure fails).
So you use it as a warning light, then let price structure confirm.
-Compression → expansion detection:
-Quiet baseline for a while, then sudden Tier-2/Tier-3 = expansion regime shift.
-Divergence (use carefully): Price makes new high, DPS-3 fails to reach prior tier intensity → weakening participation. This is most useful on HTFs or at major levels.
4) What the alerts should mean (how you set them)
-Tier-3 breach alerts: your “something serious just hit the tape” alert.
-Pressure flip alerts: best used as contextual reversal confirmation (it requires strong context in your logic).
-White core alert: extremely rare “event mode” notification—use sparingly.
5) One simple rule that keeps you out of trouble
-Don’t fade Tier-2/Tier-3 pressure just because it’s extreme. Fade only when price structure says the move failed (break of trend / reclaim failure / key level loss). DPS-3 tells you strength, structure tells you directional validity.

CCI Standard DeviationCCI Standard Deviation – Asymmetric Volatility-Adjusted Trend Filter (CCI SD)
The Commodity Channel Index (CCI), created by Donald Lambert in 1980, measures how far the typical price deviates from its statistical average to identify cyclical momentum and trend strength.
The standard formula is:
CCI = (Typical Price − SMA(Typical Price, n)) / (0.015 × Mean Deviation)
where Typical Price = (High + Low + Close)/3.
CCI is unbounded and centered around zero: sustained readings above zero indicate bullish momentum, below zero bearish. Classic interpretations often use zero-line crosses or fixed levels (±100, ±200, ±250), but these can be unreliable when CCI volatility changes across market regimes.
This indicator was developed to create a more disciplined trend-following tool that aligns with my core risk principle: “always protect to the downside.”
Starting from the standard CCI zero-line concept for trend direction, I experimented with standard deviation bands to make the oscillator volatility-adjusted. I then applied deliberate asymmetry: requiring the lower 1σ envelope (CCI − stdev) to cross above a positive threshold for bullish confirmation (high-probability entry only in robust trends), while exiting immediately on any raw CCI weakness below a negative threshold (quick downside protection). User inputs for both thresholds were added to allow fine-tuning and adaptability across different assets and timeframes.
An optional DEMA-smoothed version of the lower envelope provides additional clarity when desired.
Extreme zones
raw CCI ±240 and lower envelope > 200 or < –200 - are highlighted with background shading to flag rare acceleration or capitulation phases.
How it works
Standard CCI calculated on typical price (default length 38).
Rolling standard deviation of the CCI itself (default length 13) measures the oscillator’s recent volatility.
Lower envelope = CCI − stdev (dn).
Optional DEMA smoothing (default length 12) can be toggled.
Trend logic:
Bullish regime only when lower envelope
→ Long Threshold (default +10)
→ statistical proof of strength
Bearish/neutral immediately when raw CCI
→ Short Threshold (default –25)
→ fast downside protection
Origin and development
The indicator emerged from wanting a cleaner, more reliable CCI for trend direction. After testing volatility-adjusted versions, the asymmetric design proved superior:
it enters only high-conviction uptrends and exits rapidly on weakness, significantly reducing whipsaws while preserving trend capture.
Parameters were optimized through extensive backtests on major assets (BTC, ETH, SOL and many more Cryptos; Magnificent 7 stocks, QQQ, SPX, gold).
The defaults were selected for the best average Sortino ratio and lowest maximum drawdown across this broad universe, ensuring robustness and avoiding single-asset overfitting.
How to use it
Green triangle below bar
→ lower envelope crosses above Long Threshold
→ high-conviction bullish trend confirmed
→ enter or add to longs
Magenta triangle above bar
→ CCI crosses below Short Threshold
→ exit longs or go cash/short
While lower envelope remains above Long Threshold
→ hold bullish positions
Extreme background shading (dn >200 or CCI ±240)
→ rare high-attention zones (potential acceleration or exhaustion)
Recommended defaults
CCI length: 38
SD length: 13
Long threshold: +10
Short threshold: –25
Optional MA length: 12 (DEMA of lower envelope)
All visual elements (bar coloring, signals, background, smoothed line) are toggleable for personal preference.
This indicator is designed as a trend-strength and risk-management filter and is not intended as a standalone trading system.
Disclaimer:
This is not financial advice. Backtests are based on past results and are not indicative of future performance.

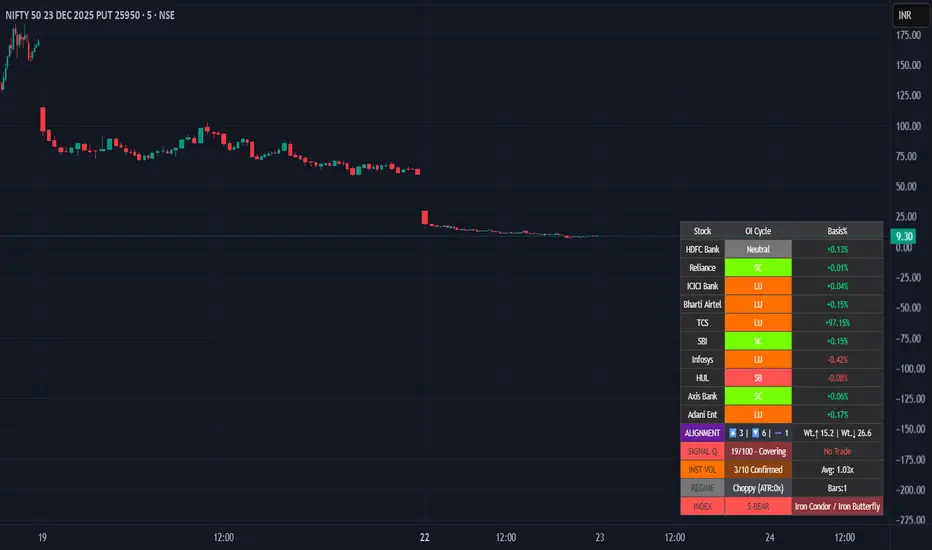
Smart Money Flow - Institutional OI & Volume Analyzer [Pro]# 🎯 Nifty Smart Money Flow - Institutional OI & Volume Analyzer
## What It Does
Professional-grade indicator that tracks **Open Interest (OI) cycles, volume footprints, and basis analysis** across Nifty 50's top 10 heavyweight stocks (representing ~54% of index weight). Identifies institutional accumulation/distribution using **4-quadrant OI analysis** combined with volume surge detection and ATR-based regime filtering.
## 🔥 Key Features
### Institutional-Grade Analytics
- **OI Cycle Detection**: Identifies Long Buildup (LB), Short Covering (SC), Short Buildup (SB), and Long Unwinding (LU) for top 10 Nifty constituents
- **Volume Validation Layer**: Detects institutional footprints via volume spikes >150-200% of 20-period MA
- **Cost of Carry Analysis**: Real-time basis tracking between spot and futures prices
- **Signal Quality Score (0-100)**: 4-component scoring system measuring alignment strength, weighted momentum, trend purity, and basis confirmation
### Advanced Regime Detection
- **Percent-Based ATR Filter**: Normalized volatility comparison prevents false signals across different price levels
- **Consecutive Bar Confirmation**: Requires 3+ bars of sustained signal before regime classification
- **Dynamic Strategy Recommendations**: Suggests optimal option structures (Call/Put Spreads, Iron Condor, Straddle) based on market regime
### Smart Money Divergence Alerts
- **Top Stock Divergence Detection**: Warns when heavyweight stocks (HDFC, Reliance, ICICI) contradict index signal
- **Pareto Principle Application**: Weights top 3 stocks (~30% index weight) for maximum predictive accuracy
## 📊 Visual Dashboard
Clean, dark-theme optimized table displaying:
- Individual stock OI cycles with color coding
- Basis/premium percentages for each heavyweight
- Alignment metrics (Bullish/Bearish/Neutral count)
- Quality score with position sizing guidance (Full Size/Spreads Only/No Trade)
- Institutional volume confirmation count
- Real-time regime status with ATR ratio
## 💡 How To Use
### For Intraday Traders (1m-15m)
1. Enable "Institutional Volume Filter" for noise reduction
2. Wait for Quality Score ≥60 for directional trades
3. Use regime-based structure recommendations (displayed in INDEX row)
### For Swing/Positional Traders (1H-Daily)
1. Focus on consecutive bar count ≥3 for trend confirmation
2. Check for divergence warnings before major positions
3. Use basis analysis to time entries (premium = bullish sentiment)
### For Options Traders
1. **Quality Score 60-100**: Full size directional (Buy Calls/Puts)
2. **Quality Score 30-60**: Spreads only (Call Spread/Put Spread)
3. **Quality Score 0-30**: Avoid directional; use Iron Condor in choppy regime
## ⚙️ Customization Options
- **10 Toggle Switches**: Show/hide individual stocks for cleaner dashboard
- **Volume Threshold**: Adjust institutional detection sensitivity (default 1.5x)
- **Regime ATR Length**: Fine-tune volatility measurement period (default 14)
- **Alignment Thresholds**: Set minimum bullish/bearish stock count for signals (default 5/10)
## 📈 Best For
- Nifty 50 Index traders (Futures & Options)
- Bank Nifty analysis (3 major banks included)
- Institutional flow tracking
- Multi-stock correlation analysis
- Regime-based strategy adaptation
## 🚨 Alerts Included
✅ Strong Bullish Signal (7+ stocks aligned + volume confirmation)
✅ Strong Bearish Signal (7+ stocks aligned + volume confirmation)
✅ Divergence Warning (Top stocks contradict index move)
✅ Institutional Volume Surge (7+ stocks with volume spikes)
## 📚 Technical Foundation
Based on institutional trading principles:
- **Order Flow Analysis**: Price + OI correlation for position identification
- **Smart Money Concepts**: Volume profile + basis analysis for institutional tracking
- **Regime Filtering**: Adaptive strategy selection based on volatility environment
- **Weighted Aggregation**: Pareto principle ensures top stocks drive signal quality
## 🔧 Version History
- v6.0: Initial release with 10-stock coverage
- Optimized request.security() calls: 30 total (3 per stock)
- Dynamic table rendering with barstate.islast efficiency
## 📌 Important Notes
- **Data Source**: NSE India (Spot + Futures + OI)
- **Update Frequency**: Real-time (dependent on chart timeframe)
- **Best Timeframes**: 5m, 15m, 1H, Daily
- **Avoid**: Pre-market hours (OI data may be stale)
---
**Category**: Volume / Order Flow
**Market**: NSE India - Nifty 50
**Timeframe**: Multi-timeframe (1m to Daily)
**Complexity**: Advanced (suitable for intermediate to professional traders)
## Tags (for SEO)
#nifty50 #orderflow #openinterest #institutional #smartmoney #volume #regime #niftyfutures #niftyoptions #oi #banknifty #heavyweights #basis #costofcarry #divergence #qualityscore #nseindia #optionstrading #algorithmic #quantitative
Exhaustion Levels[Sahebson] v2.0🎯 Overview
Exhaustion Levels is a sophisticated price action indicator designed to identify market exhaustion points — moments when buying or selling pressure has potentially reached its limit and a reversal may be imminent.
Unlike traditional oscillators that lag behind price, this indicator analyzes real-time price dynamics to pinpoint high-probability reversal zones before they fully develop.
✨ Key Features
🔺 Exhaustion Detection
Bullish Exhaustion (Green Triangle): Identifies potential bottoming patterns where selling pressure appears exhausted
Bearish Exhaustion (Red Triangle): Detects potential topping patterns where buying pressure appears exhausted
📊 Dynamic Support & Resistance
Automatically plots key levels based on exhaustion points
Levels persist until new exhaustion events occur
Visual confirmation of significant price zones
🤖 Bot-Ready Alerts
JSON-formatted alerts for webhook integration
Compatible with 3Commas, Cornix, Alertatron, and custom bots
Includes ticker, exchange, price, and timestamp data
Human-readable + machine-parseable format
⚙️ Fully Customizable
Adjustable sensitivity parameters
Toggle exhaustion arrows on/off
Toggle support/resistance levels on/off
Customizable line thickness
📈 How To Use
Entry Signals
Buy Signal (🟢): When a green triangle appears below a candle, it suggests potential bullish exhaustion — consider long entries
Sell Signal (🔴): When a red triangle appears above a candle, it suggests potential bearish exhaustion — consider short entries or exits
Support & Resistance
Use the automatically generated levels as potential take-profit zones
Previous exhaustion levels often act as future support/resistance
Combine with your existing S/R analysis for confluence
Best Practices
✅ Use on higher timeframes (1H, 4H, Daily) for more reliable signals
✅ Combine with volume analysis for confirmation
✅ Wait for candle close before acting on signals
✅ Use proper risk management — no indicator is 100% accurate
✅ Backtest on your preferred assets before live trading
🎨 Visual Guide
ElementColorMeaning🔺 Green TriangleBelow candlePotential bullish reversal🔻 Red TriangleAbove candlePotential bearish reversal🟩 Green LineSupport levelPrevious bullish exhaustion zone🟥 Red LineResistance levelPrevious bearish exhaustion zone
⚙️ Settings Explained
SettingDefaultDescriptionShow Exhaustion Arrows✅ OnDisplay buy/sell trianglesShow Exhaustion Levels✅ OnDisplay S/R linesExhaustion Swing Length40Lookback period for analysisExhaustion Bar Count10Sensitivity thresholdLine Thickness2Width of S/R lines
Tip: Lower values = more signals (higher sensitivity), Higher values = fewer signals (higher quality)
📊 Recommended Assets
This indicator works on any liquid market:
✅ Stocks (SPY, QQQ, AAPL, TSLA)
✅ Crypto (BTC, ETH, SOL)
✅ Forex (EUR/USD, GBP/USD)
✅ Futures (ES, NQ, CL)
✅ Indices (US500, US100, US30)
⚠️ Disclaimer
This indicator is provided for educational and informational purposes only. It is not financial advice. Past performance does not guarantee future results. Always do your own research and use proper risk management. Trading involves substantial risk of loss.

Turtle Breakout Pro (Low DD Mode)Turtle Breakout Pro (Low DD Mode) is a trend-following breakout strategy built to participate only in higher-quality expansions while actively limiting exposure during unfavorable phases.
1. Core idea
This strategy focuses on capturing directional moves that begin with a clear price expansion beyond a recent range. It aims to trade only when the market shows both direction and commitment, avoiding entries that are likely to fade back into congestion.
2. Breakout validation
Signals are not triggered by a single touch or a marginal break. The strategy requires price to clear a breakout area with a safety margin and then demonstrate continued acceptance beyond that level. This confirmation behavior is designed to reduce false breakouts and late-session spikes that immediately retrace.
3. Market quality filters
Trades are allowed only when broader conditions support trend continuation. The strategy can enforce a directional bias filter, a trend-strength filter, a volatility suitability check, and an optional participation filter based on activity. The intent is to avoid breakouts that occur in weak, ill-conditioned environments where continuation is statistically less reliable.
4. Adaptive risk and sizing
Position size is dynamically adjusted so that risk remains proportional to current volatility. Instead of using fixed size, the strategy scales exposure based on how much the market can realistically move against the position in normal conditions. This is designed for multi-market use and for maintaining consistency across changing volatility regimes.
5. Exit framework
Exits are layered rather than single-purpose. The strategy uses a protective stop to define invalidation, can progressively protect profits as the trade moves in favor, and can optionally take profits at a logical expansion distance. In addition, a structure-based exit can close positions when the market violates a shorter-term boundary, aiming to avoid giving back too much during reversals.
6. Time and stagnation control
The strategy can enforce a maximum holding time to prevent capital being tied up in trades that stop progressing. If the market does not deliver continuation within a reasonable window, the position is closed to reduce opportunity cost and limit slow drawdown behavior.
7. Drawdown control behavior
A key feature is its defensive trading mode. After a loss, the strategy can temporarily reduce activity by waiting before taking new trades. It can also stop initiating new positions if overall drawdown exceeds a defined tolerance relative to the equity peak. The goal is to avoid “death by a thousand cuts” during noisy regimes.
8. Best conditions
It performs best when markets transition from consolidation into sustained trends, especially on liquid instruments where breakouts can carry through. It is typically more stable when volatility is present but not chaotic, and when trending conditions persist long enough for trailing protection to work.
9. When to avoid
Avoid using it in tight, mean-reverting ranges and during highly erratic whipsaw periods where breakouts frequently fail. In these phases, even well-filtered breakout systems can accumulate small losses and trigger defensive pauses.
10. What to expect
Expect fewer but higher-quality entries compared to basic breakout systems. Many trades will be small wins or small losses, with occasional larger winners when a strong trend develops. The strategy is designed to prioritize smoother equity behavior over maximum trade frequency.

UVOL Thrust TrackerUVOL Thrust Tracker identifies institutional breadth thrusts using NYSE up-volume as a percentage of total volume (USI:UVOL / USI:TVOL), plotted directly on price.
The indicator highlights:
TRUE 90% UVOL thrusts (rare, high-conviction breadth events)
Surrogate thrust clusters (multi-day 80–89% participation)
Cluster failures (momentum that fails to expand)
Structural thrust failures (2022-style false starts)
A regime filter based on the chart symbol’s moving averages separates bull vs bear environments, dynamically adjusting thresholds and failure logic.
This tool is designed for regime confirmation and risk management, not short-term entries. TRUE thrusts typically confirm trend continuation, while failures warn when breadth support breaks down.
Note: This indicator is intended for regime and risk assessment, not precise entries or exits.

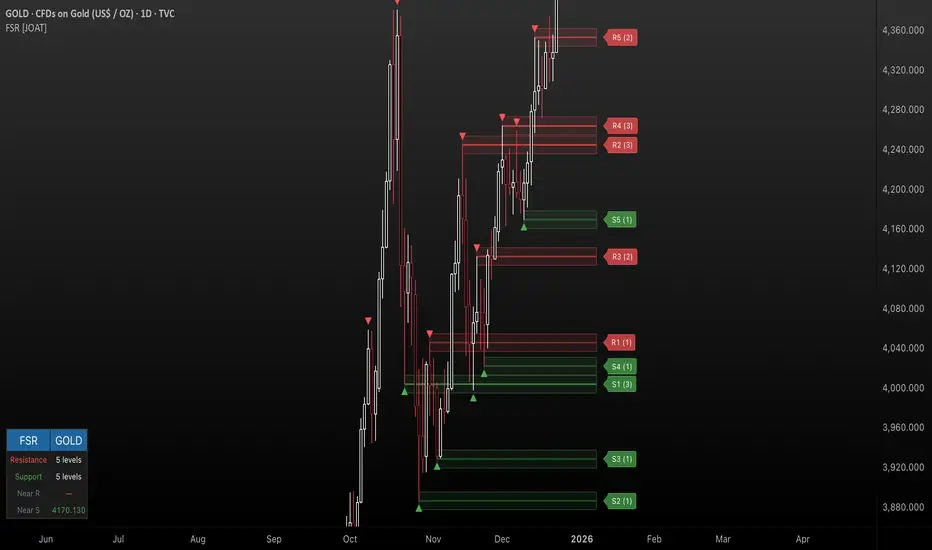
Fractal Support & Resistance [JOAT]
Fractal Support & Resistance — Automatic Level Detection with Volume Weighting
Fractal Support & Resistance automatically identifies key price levels using a proprietary combination of fractal detection, volume analysis, and dynamic touch counting. Levels are intelligently styled based on their strength and how many times they have been tested, giving you instant visual feedback on level importance.
Why This Script is Protected
This script is published as closed-source to protect the proprietary level management algorithm and the unique volume-weighted strength calculation methodology from unauthorized republishing. The specific implementation of touch detection, level merging logic, and dynamic opacity calculations represents original work that differentiates this from standard fractal indicators.
What Makes This Indicator Unique
Unlike basic fractal indicators that simply mark pivot points, this system:
Tracks how many times each level has been tested (touch counting)
Weights level importance by volume at the fractal point
Merges nearby fractals into single levels instead of cluttering the chart
Dynamically adjusts visual opacity based on level strength
Provides zone boxes around levels for realistic price reaction areas
What This Indicator Does
Detects fractal pivot highs and lows to establish support and resistance levels
Tracks how many times each level has been touched or tested
Weights level importance by volume at the fractal point
Draws extending lines and zone boxes for each level
Dynamically adjusts level opacity based on touch count for visual strength indication
Provides a dashboard with nearest levels and counts
Core Methodology
The indicator uses Williams Fractal concepts as a foundation but extends them with proprietary enhancements:
Fractal Detection — Identifies pivot highs and lows where price creates local extremes with confirmation bars on each side. A fractal high requires the highest point with lower highs on both sides; a fractal low requires the lowest point with higher lows on both sides.
Level Clustering — New fractals within a tolerance zone (based on Zone Padding %) update existing levels rather than creating duplicates. This keeps the chart clean and focuses on significant price areas.
Volume Integration — Volume at each fractal point is accumulated to weight level significance. Higher volume fractals are considered more important.
Touch Tracking — The system monitors when price approaches existing levels and increments touch counts. More touches indicate stronger, more significant levels.
Visual Strength System
Level appearance changes dynamically based on market interaction:
Newer or less-tested levels appear more transparent (up to 80% transparency)
Each additional touch reduces transparency by 15%
Heavily tested levels become more prominent and opaque (minimum 20% transparency)
Labels display level number and touch count (e.g., "R1 (3)" = Resistance 1 with 3 touches)
Zone boxes provide visual areas around each level
Color Scheme
Resistance Color — Default: #FF5252 (red) — Used for resistance levels and zones
Support Color — Default: #4CAF50 (green) — Used for support levels and zones
Zone Fill — 90% transparent version of level color
Zone Border — 70% transparent version of level color
Labels — 30% transparent background with white text
Dashboard Information
The on-chart table (bottom-left corner) displays:
Number of active resistance levels meeting minimum touch requirement
Number of active support levels meeting minimum touch requirement
Nearest resistance level above current price
Nearest support level below current price
Inputs Overview
Fractal Settings:
Fractal Period — Bars on each side for fractal confirmation (default: 2, range: 1-10)
Max Levels Per Side — Maximum resistance and support levels to track (default: 5, range: 1-20)
Zone Padding (%) — Level zone width as percentage of price (default: 0.2%, range: 0-2%)
Filtering:
Volume Weight Levels — Toggle volume-weighted level importance (default: on)
Min Touches to Show — Filter out levels with fewer touches (default: 1, range: 1-10)
Lookback Period — Historical bars to analyze for level detection (default: 200, range: 50-500)
Visual Settings:
Resistance/Support Colors — Customizable color scheme
Show Zone Boxes — Toggle filled zone areas around levels
Show Level Labels — Toggle level labels with touch counts
Show Fractal Markers — Toggle small triangles at fractal points
Show Dashboard — Toggle the information table
Line Width — Thickness of level lines (default: 2, range: 1-5)
How to Use It
For Support/Resistance Trading:
Use levels with higher touch counts as stronger support/resistance references
More opaque levels have been tested more times and are more significant
Watch for price reactions at zone boundaries, not just exact level prices
Combine with candlestick patterns at levels for entry signals
For Breakout Trading:
Watch for breakouts when price closes beyond a level
Levels with many touches that finally break often produce strong moves
Use the zone box—a close beyond the zone is more significant than just touching the level
Set alerts for resistance/support breaks
For Target Setting:
Use the nearest resistance as a profit target for long positions
Use the nearest support as a profit target for short positions
Dashboard shows these levels for quick reference
Alerts Available
FSR Resistance Break — Price closes above a resistance level
FSR Support Break — Price closes below a support level
FSR New Fractal High — Fresh fractal high detected
FSR New Fractal Low — Fresh fractal low detected
Best Practices
Increase Fractal Period for fewer but more significant levels
Use Min Touches filter to show only well-tested levels
Volume weighting helps identify institutionally significant levels
Combine with trend indicators—trade with the trend at levels
This indicator is provided for educational purposes. It does not constitute financial advice. Past performance does not guarantee future results. Always conduct your own analysis and use proper risk management before making trading decisions.
— Made with passion by officialjackofalltrades
Ultimate Pattern Engine - Elite Suite v54Here's the description I wrote for your Pine Script publication:
Ultimate Pattern Engine - Elite Suite v54
A comprehensive technical analysis tool combining multiple pattern recognition algorithms and indicators in one powerful suite.
Pattern Recognition:
Head & Shoulders patterns with automatic neckline detection
Bull and Bear flag formations
9-count sequential patterns
Breakout pattern detection with alerts
Support/Resistance zones with dynamic S/R levels
Reversal cloud visualization
Moving Averages:
Multiple Simple Moving Averages (SMA) - 9, 50, 200 periods
Exponential Moving Averages (EMA) with customizable lengths
Color-coded for easy trend identification
Visual Features:
Pattern fill areas for clear visualization
Breakout labels showing price action
Customizable color schemes (bullish green, bearish red, neutral gray)
H&S neckline highlighting
Volume multiplier analysis
Configuration:
Adjustable sensitivity and flatness thresholds
Toggle individual patterns on/off
Customizable moving average periods and colors
Full control over visual elements
Ideal for traders looking to identify key chart patterns, trend reversals, and breakout opportunities across all timeframes.

SMC Execution Engine by @abdallacryptoSMC Execution Engine by @abdallacrypto is a Smart Money Concepts structure and execution toolkit that turns price action into a clear, rules-based map.
It automatically detects swing structure, BOS and CHOCH, tracks the active structural anchor, and projects clean Fibonacci retracement levels built from the current context. It also draws the latest context Order Block and adds optional intrabar alerts for high-probability confluence events (OB touches, 0.79 and 0.618 fib interactions, OB plus fib, and sequential “fib then OB” logic). A multi-timeframe HUD (5m to 1M) shows structural bias and RSI so you can align execution with higher-timeframe context.
This is not a buy/sell signal generator. It is a structure reader and execution framework designed to reduce noise, improve consistency, and help you act with clarity.
Suggested use: identify context with CHOCH and anchor, wait for price to return to key fib levels and the active Order Block, then execute your own risk plan.
Full documentation:
🇺🇸 beneficial-hyena-c1e.notion.site
🇧🇷 beneficial-hyena-c1e.notion.site
🇪🇸 beneficial-hyena-c1e.notion.site

AM/PM Session LevelsAM/PM Session Levels with Real-Time Updates
This indicator plots intraday high, low, and midpoint levels for the AM and PM trading sessions, with live-updating visuals designed for precision and clarity.
Features
AM Session: 9:30 AM to 10:00 AM EST
PM Session: 1:30 PM to 2:00 PM EST
Live High/Low Tracking: Lines begin at the exact candle where session highs or lows are formed and update dynamically.
Session Boxes: Visual boxes extend from session start to the most recent bar, adjusting in real time to reflect the current session range.
Midpoint Lines: The 50% level (CE) is calculated and displayed after each session ends.
Customization Options:
Line styles, widths, and colors for each session
Label texts
Box visibility, fill, and border styling
Intended Use
This tool is ideal for intraday traders looking to reference session-based levels for decision-making. It provides clear visual separation of session structure and helps identify key reaction areas throughout the trading day.
Developed by Ralvarez
Version 1.0 — December 2025

Monthly Seasonality (for last N Years)Monthly Seasonality analyzes historical price behavior to reveal how a symbol typically performs in each calendar month. It helps traders identify recurring seasonal patterns, stronger months, weaker months, and overall consistency across years.
What this indicator does?
1. Calculates monthly percentage returns using historical price data
2. Aggregates results over a user-defined lookback period (max up to 20 years)
3. Displays a seasonality table showing:
> Average return (%) for each month
> Win rate (%) — how often the month closed positive
> Number of years included in the calculation
4. Automatically highlights:
> 📈 Best performing month
> 📉 Worst performing month
Seasonality Table:
Green shading indicates positive average returns
Red shading indicates negative average returns
⭐ A star marks the strongest and weakest months
Table colors automatically adapt to light and dark themes
Table position is fully customizable (top, middle, bottom)
How Traders Use It?
Identify seasonally strong months for swing trades or position entries
Avoid historically weak periods or tighten risk controls
Combine with technical indicators for higher-probability trade timing
Useful for equities, ETFs, and indices with long trading histories
Examples:
1. AAPL
2. BTCUSD

Volume Spread Analysis with Cues⚖️Volume Spread Analysis with Cues (VSA)
Volume Spread Analysis with Cues is an indicator that analyzes the relationship between price spread and volume to reveal market intent. Instead of treating volume in isolation, this script classifies each candle into meaningful VSA conditions such as accumulation, distribution, absorption, momentum, exhaustion, and traps.
🔑Key Features
True price spread calculation (optional gap-inclusive mode)
Candle spread analysis
Volume analysis
Candle close quality analysis (strong, weak, or neutral)
Visual emoji cues
Detailed tooltips explaining each signal and its confirmations
Built-in alerts for demand, supply, and trap scenarios
📏 How to Use
This script is context-driven, not a signal generator. It is designed to be used alongside:
Support & resistance
Market structure
Higher-timeframe bias
The strongest setups occur when VSA cues align with key levels and trend direction! Confluence is your friend.
🚨Alerts Included
VSA Demand Cue – potential accumulation or continuation
VSA Supply Cue – potential distribution or absorption
VSA Trap Cue – exhaustion or false breakout behavior
⚠️ Beware
Not every cue is tradable on its own
Confirmation and location are critical

Price Prediction Forecast ModelPrice Prediction Forecast Model
This indicator projects future price ranges based on recent market volatility.
It does not predict exact prices — instead, it shows where price is statistically likely to move over the next X bars.
How It Works
Price moves up and down by different amounts each bar. This indicator measures how large those moves have been recently (volatility) using the standard deviation of log returns.
That volatility is then:
Projected forward in time
Scaled as time increases (uncertainty grows)
Converted into future price ranges
The further into the future you project, the wider the expected range becomes.
Volatility Bands (Standard Deviation–Based)
The indicator plots up to three projected volatility bands using standard deviation multipliers:
SD1 (1.0×) → Typical expected price movement
SD2 (1.25×) → Elevated volatility range
SD3 (1.5×) → High-volatility / stress range
These bands are based on standard deviation of volatility, not fixed probability guarantees.
Optional Drift
An optional drift term can be enabled to introduce a long-term directional bias (up or down).
This is useful for markets with persistent trends.

0ABCBuy and Sell signals by 2nd Entry strategy. It's not ready yet. But, we still can use it. I will add more things in the future hoping to make a profitable strategy that work in low timeframe Crypto markets. We are using multiple RSI for filtering.

Neural Trend Engine [JOAT]Neural Trend Engine - Multi-Layer Adaptive Trend Detection
Neural Trend Engine uses a multi-layer filtering approach inspired by neural network concepts. It combines multiple adaptive moving averages with proprietary momentum and volatility weighting to generate trend signals with reduced lag and improved confidence scoring.
Why This Script is Protected
This script is published as closed-source to protect the proprietary signal composition algorithm and the specific weighting methodology from unauthorized republishing. The unique combination of adaptive layer calculations, momentum normalization, and volatility integration represents original work that goes beyond standard indicator implementations.
What Makes This Indicator Unique
Unlike simple moving average crossover systems, Neural Trend Engine:
Uses three Kaufman Adaptive Moving Averages (KAMA) that automatically adjust their smoothing based on market efficiency
Combines layer alignment, momentum, and volatility into a single "neural signal"
Provides signal strength percentages so you know the conviction level of each signal
Creates a visual trend cloud that makes direction immediately obvious
What This Indicator Does
Plots three adaptive moving average "layers" that respond dynamically to market efficiency
Creates a trend cloud between fast and slow layers for visual trend identification
Generates weighted composite signals from layer alignment, momentum, and volatility
Displays buy/sell labels with signal strength percentages
Provides a comprehensive dashboard with multi-component breakdown
Colors the neural line and cloud based on current trend direction
Core Methodology
The indicator employs a three-layer adaptive system where each layer responds to market conditions at different speeds:
Fast Layer (default: 8) — Quick response for short-term direction changes
Medium Layer (default: 21) — Intermediate trend reference
Slow Layer (default: 55) — Long-term trend anchor
Each layer uses efficiency-based adaptation, meaning they become more responsive during trending conditions and smoother during choppy markets.
The neural signal is a proprietary composite that weighs three distinct market components:
Momentum Component (default: 40%) — Measures directional price velocity, normalized to its recent range
Trend Component (default: 35%) — Evaluates alignment between the three adaptive layers
Volatility Component (default: 25%) — Incorporates market volatility state into signal generation
These components are combined using a weighted formula that has been calibrated to balance responsiveness with noise reduction.
Signal Generation
Direction changes occur when the smoothed neural signal crosses a configurable strength threshold:
Bullish — Signal exceeds positive threshold with layer alignment confirmation
Bearish — Signal drops below negative threshold with layer alignment confirmation
Neutral — Signal remains within threshold range, indicating consolidation
Signal strength percentages indicate the conviction level of each signal, helping traders assess trade quality. Higher percentages suggest stronger trend conviction.
Visual Features
Trend Cloud — Filled area between fast and slow layers, colored by trend direction
Neural Line with Glow — Weighted average of all three layers with glow effect
Medium Layer — Subtle white line showing intermediate trend
Signal Labels — BUY/SELL labels with strength percentages at signal points
Small Markers — Alternative triangle markers when labels are disabled
Color Scheme
Bullish Color — Default: #26A69A (teal green) — Used for bullish trends and signals
Bearish Color — Default: #EF5350 (red) — Used for bearish trends and signals
Cloud Fill — 85% transparent version of trend color
Neural Line Glow — 60% transparent version for glow effect
Dashboard Information
The on-chart table (top-right corner) displays:
Current direction (BULLISH, BEARISH, or NEUTRAL)
Neural signal percentage
Layer alignment status (ALIGNED UP, ALIGNED DOWN, or MIXED)
Momentum direction and percentage
Trend strength percentage
Inputs Overview
Neural Layers:
Fast Layer — Period for fast adaptive MA (default: 8, range: 2-50)
Medium Layer — Period for medium adaptive MA (default: 21, range: 5-100)
Slow Layer — Period for slow adaptive MA (default: 55, range: 10-200)
Source — Price source for calculations (default: close)
Sensitivity:
Momentum Weight — Weight for momentum component (default: 0.4)
Trend Weight — Weight for trend/layer alignment (default: 0.35)
Volatility Weight — Weight for volatility component (default: 0.25)
ATR Period — Period for volatility calculations (default: 14)
Visual Settings:
Bullish/Bearish Colors — Customizable color scheme
Show Trend Cloud — Toggle the filled cloud area
Show Signal Labels — Toggle BUY/SELL labels with percentages
Show Neural Line — Toggle the main trend line
Show Dashboard — Toggle the information table
Alerts:
Await Bar Confirmation — Wait for bar close before triggering (recommended)
Min Signal Strength — Threshold for direction changes (default: 0.3 = 30%)
How to Use It
For Trend Following:
Follow the trend cloud color for overall market direction
Enter long when cloud turns bullish (teal) and signal strength is high
Enter short when cloud turns bearish (red) and signal strength is high
Use the neural line as a trailing stop reference
For Signal Trading:
Wait for BUY/SELL labels to appear
Check the signal strength percentage—higher is better
Confirm with dashboard showing aligned layers
Avoid signals during MIXED layer alignment
For Confirmation:
Use Neural Trend Engine to confirm signals from other systems
Strong confirmation when all three layers are aligned
Dashboard shows momentum and trend strength for additional context
Alerts Available
NTE Buy Signal — Bullish direction change detected
NTE Sell Signal — Bearish direction change detected
NTE Direction Change — Any trend direction change
Best Practices
Higher signal strength percentages indicate more reliable signals
Wait for layer alignment (shown in dashboard) before entering trades
Use on higher timeframes for more reliable trend identification
Combine with support/resistance levels for entry timing
This indicator is provided for educational purposes. It does not constitute financial advice. Past performance does not guarantee future results. Always conduct your own analysis and use proper risk management before making trading decisions.
— Made with passion by officialjackofalltrades


COT Seasonality 1W ForecastCOT Seasonality - Historical COT Positioning Patterns Throughout the Year
Displays average COT positioning (Commercials vs. Small Speculators) over 15+ years as weekly seasonality curves. Uses WillCo Index methodology to calculate Smart Money positioning.
Features:
- 52-week COT average curves (Commercials & Small Specs)
- 8-week future projection based on historical patterns
- Adjustable lookback (up to 2 years visible)
- Deviation analysis: Current COT value vs. Seasonality
- Divergence detection between Commercials and Small Specs
- For all 8 major Forex currencies (USD, EUR, JPY, GBP, AUD, NZD, CAD, CHF)
Important: Use on WEEKLY chart only!
Based on CFTC Legacy Reports. Smart Money Index = (Commercials Index - Small Specs Index + 100) / 2

