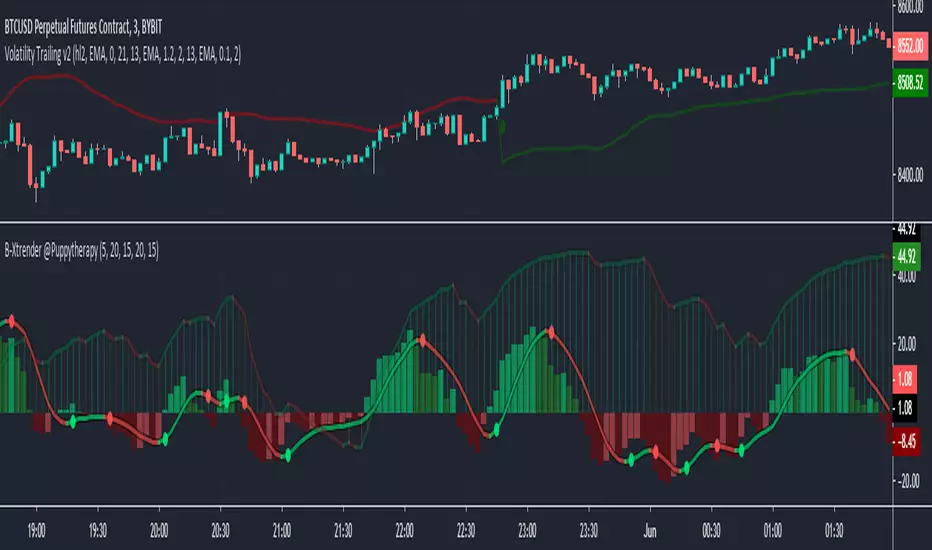
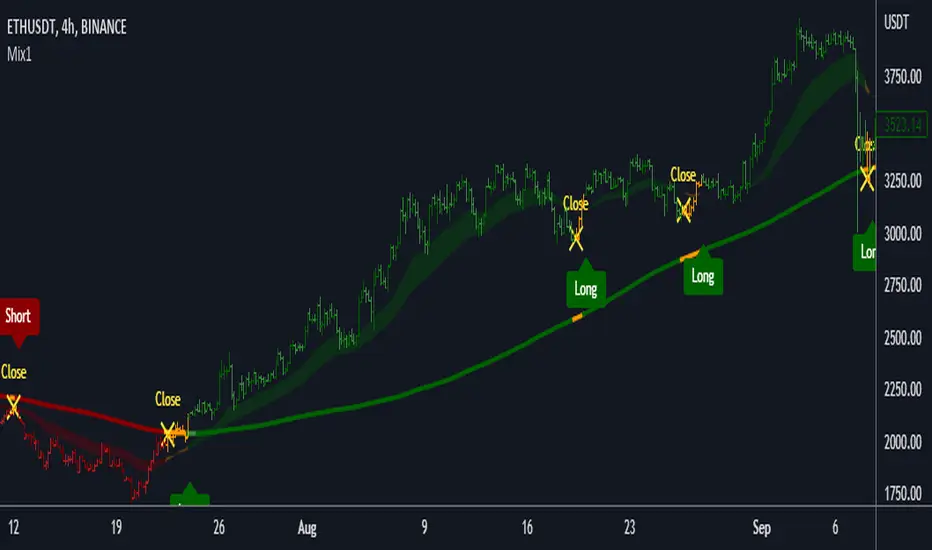
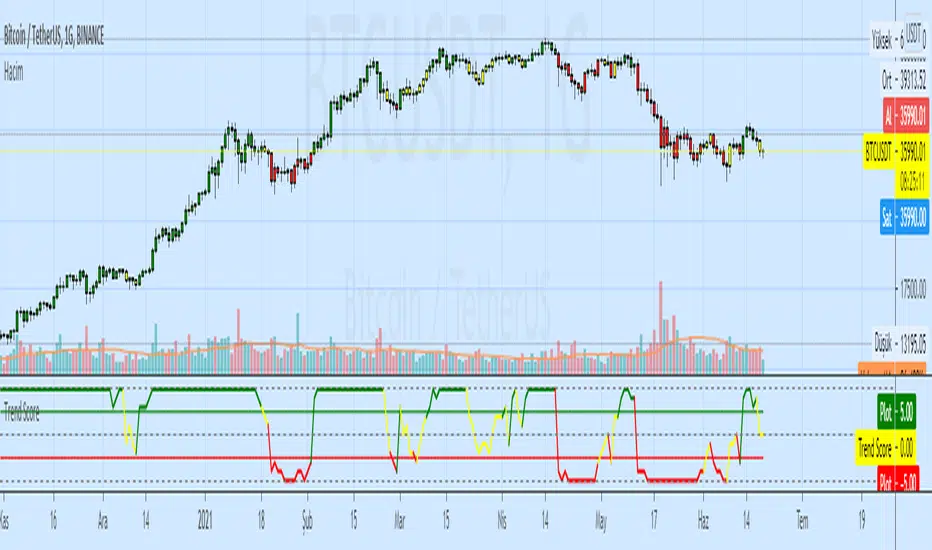
Price Action Channel for Market direction on any Time Frame. Very simple indicator to identify determined moves Bull or Bear. When price moves above Green line you have a stronger chance for a Bullish move. When price moves below red line you have a strong chance for bearish move. Trade either move until price re-enters channel. When price is in channel expect mostly chop.
Pine script version 3 Author CryptoJoncis RSIOMA is the abbreviation for Relative Strength index (RSI) of moving averages (MA). This custom built indicator is based on calculating the relative strength of two moving averages and the smoothes out the RSI using a moving average. Combined, the RSIOMA oscillator depicts trend changes in prices relative to the time...
This indicator paints the background of the chart between 2 EMAs when all 3 given EMAs are in sync. The default settings are: Long-term EMA: 200 Period. Short-term EMA 1: 50 Period. Short-term EMA 2: 20 Period. So according to the default settings, when the 20EMA is above the 50EMA, and the 50EMA is above the 200EMA, the area between the 20EMA and the...
// A simple crossover strategy with 4 Jurik's moving average lines UPDATE
A quadratic regression is the process of finding the equation that best fits a set of data.This form of regression is mainly used for smoothing data shaped like a parabola. Because we can use short/midterm/longterm periods we can say that we use a Quadratic Least Squares Moving Average or a Moving Quadratic Regression. Like the Linear Regression (LSMA) a...
Hi folks! Here a script uses the moving average cloud. A sma (50, aqua) and a sma (200, olive) are plotted on the cart. When both sma go up the cloud is green. When both sma go down the cloud is red. When sma (200, olive) goes down and sma (50, aqua) goes up the cloud is orange. When sma (200, olive) goes up and sma (50, aqua) goes down the cloud is lime. There...
For those who like to trade with the trend instead of against it. This little script shows you what side of the daily/weekly/monthly timeframe open, price is currently trading at so that you dont accidentally trade against the higher timeframe momentum. Timeframes are customizable through the indicator settings panel.
It's the ANN, the original version with repainting issue got taken care of. The result as you can see, it's might not be that good compare to original. If anyone want to put it into a strategy, feel free. I do not recommend you to use this as a stand alone. Trade with your own risk. Maybe trade the opposite way might do it lol
T3 Moving Average indicator was originally developed by Tim Tillson in 1998/99. T3 Moving Average is considered as improved and better to traditional moving averages as it is smoother and performs better in trending market conditions. It offers multiple opportunities when the price is in the state of retracement and therefore allows to minimize your exposed risk...
This script is similar to the "Hi-Lo" or "Clear" methods of painting bars. Instead of using the tips/edges of the candles like those two, the "(H+L)/2" method uses the change in (high+low)/2 to paint the bars. This gives you some similar results if you were to be binary with the candle coloring. However, my coloring scheme is not entirely binary. There are 5...
Keltner Channel and RSI use together. They tell us when the trend will turn. Fave fun!!
The related article is copyrighted material from Stocks & Commodities. Strategy by HPotter. WARNING: - This script to change bars colors.