Baseline - evoPlots the high and low of your chosen moving average.
Options are:
SMA = Simple Moving Average
EMA = Exponential Moving Average
WMA = Weighted Moving Average
HMA = Hull Moving Average
VWMA = Volume Weighted Moving Average
RMA = Exponetial Weighted Moving Average
ALMA = Arnaud Legoux Moving Average
Unbox "Use Current Timeframe" to use chosen timeframe below
I mainly use this to get in and out of the market for futures trading, to reduce fake outs of having just one moving average line.
Let me know if you like it..
Inspired from LazyBear's EMAenvelope :)
Timeframe
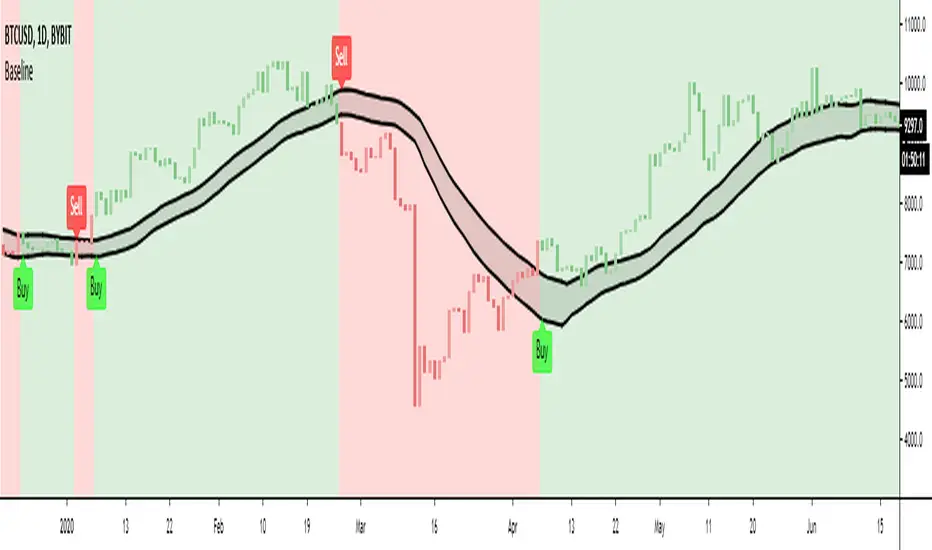

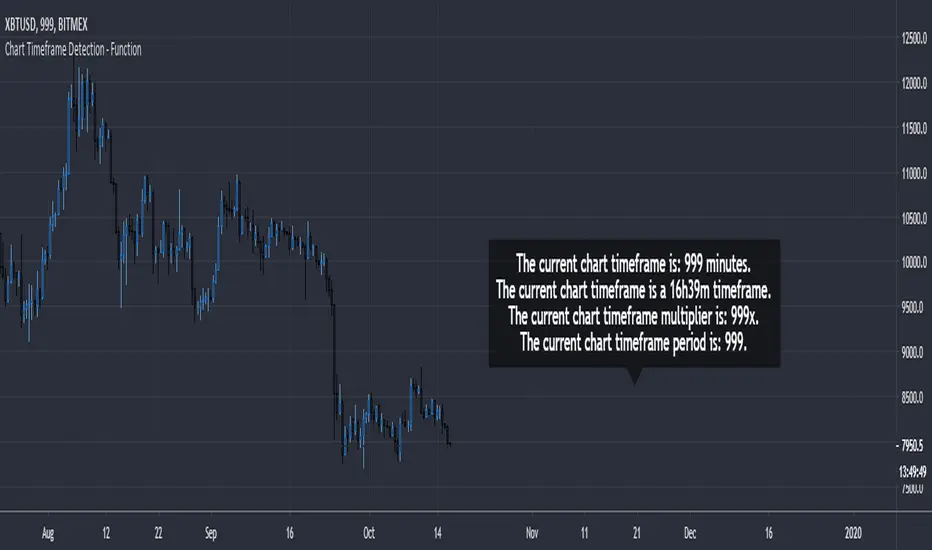
Chart Timeframe Detection - FunctionChart Timeframe Detection - Function
A small and effective function to detect the current chart timeframe in minutes.
It can be used to further detect a specific chart timeframe (a daily timeframe or even a 16h39m timeframe).
The result is returned as integer.
Binary Options Arrows (example)An example of Binary Option Arrows (BOA) for candlestick patterns bearish and bullish harami.
With results as coloured background and an option to choose your expiration (one candle by default).
It's just an example for those who has their own strategy and wants to make nice arrows in their chart.
All you need to do is rewrite piece of script in lines 9:13 - feel free to ask me for any help.
Disclaimer: It's just an example how to script arrows for binary option trading, Poshtrader is not responsible for any loss of money by using this particular strategy.
Happy Trading

Multi TF - RSIRSI with 5 timeframes, you can change the TF it in the configs.
This one has 1h, 2h, 4h, Daily and Weekly.

Custom Timeframe FibsThis is a testing project for fib levels to try out fivs on multi timeframes
Thank you ShoujiSuzuki

Elgrand - Overbought Rsi and StochRsi on multiple timeframesScript to visualize the overbought and oversold condition on multiple timeframes. Good way to determine when you have a lower risk for enter a trade or to determine when you need to be on the lookout to sell.

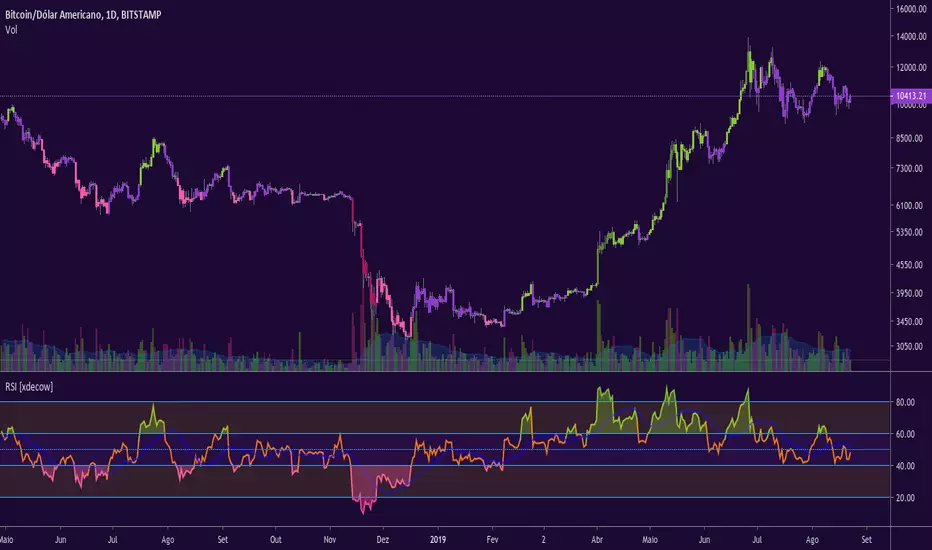
RSI [xdecow]RSI MTF
Options:
-MA
-RSI from another timeframe
-Uptrend/Downtrend zone
-barcolor based on RSI trend
Supertrend MTF Heatmap V2Hello traders and aspiring Pinescripters
You might remember this script Supertrend-Heatmap-Multi-timeframes/ ?
A follower, asked me in a comment to do a version where YOU guys can select the timeframes
Well... what follower asks, follower (sometimes) gets. I'm not Santa Claus but this is Christmas with a few months in advance (#oh #oh #oh)

Divergences multi timeframeMT div monitor, add your own input for divs under expressions. Add them to the original bulldivs or beardivs with +. Set div_threshold in inputs.

Week High MTFSimple script to plot weekly data into your chart and as example how MTF works in pine script.
I use it for the 52 week high but you can choose other sources as well f.e. HL2 or close to reduce noise from wicks, also define your own length.


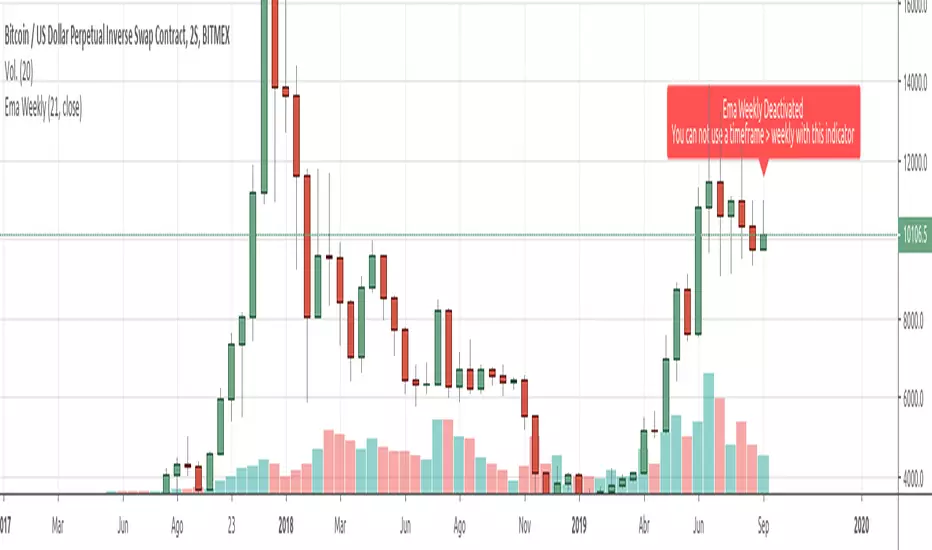
Ema Weekly In current TimeframeThis simple indicator shows the Ema with data extracted from weekly timeframe in your current displayed timeframe.
Due to Tradingview working restrictions, this indicator only works if is used in a timeframe lower (or equal) to one week, otherways shows an error red label showing this error.
All my scripts:
es.tradingview.com

Dollar Cost Average (Data Window Edition)Hi everyone
Hope you had a nice weekend and you're all excited for the week to come. At least I am (thanks to a few coffee but that still counts !!!)
This indicator is inspired from Dollar-Cost-Average-Cost-Basis
EDUCATIONAL POST
The educational post is coming a bit later this afternoon explaining how to use the indicator so I would advise to follow me so that you'll get updated in real-time :) (shameless self-advertising)
1 - What is Dollar-Cost Averaging (DCA)?
Dollar-Cost Averaging is a strategy that allows an investor to buy the same dollar amount of an investment on regular intervals. The purchases occur regardless of the asset's price.
I hope you're hungry because that one is a biggie and gave me a few headaches. Happy that it's getting out of my way finally and I can offer it
This indicator will analyse for the defined date range, how a dollar cost average (DCA) method would have performed vs investing all the hard earnt money at the beginning
2- What's on the menu today ?
Please check this screenshot to understand what you're supposed to see : CLICK ME I'M A SCREENSHOT (I'll repeat this URL one more time below as I noticed some don't read the information on my description and then will come pinging me saying "sir me no understand your indicator, itz buggy sir"
(yes I finally thought about a way to share screenshots on TradingView, took me 4 weeks, I'm slow to understand things apparently)
My indicator works with all asset classes and with the daily/weekly/monthly timeframes
As always, let's review quickly the different fields so that you'll understand how to use it (and I won't get spammed with questions in DM ^^)
- Use current resolution : if checked will use the resolution of the chart
- Timeframe used for DCA : different timeframe to be used if Use current resolution is unchecked
- Amount invested in your local currency : The amount in Fiat money that will be invested at each period selected above
- Starting Date
- Ending Date
- Select a candle level for the desired timeframe : If you want to use the open or close of the selected period above. Might make a diffence when the timeframe is weekly or monthly
3 - Specifications used
I got the idea from this website dcabtc.com and the result shown by this website and my indicator are very interesting in general and for your own trading
The formula used for the DCA calculation is that one : Investopedia Dollar Cost Average
4 - How to interpret the results
"But sir which results ??"...... those ones : CLICK ME I'M A SCREENSHOT :) (strike #2 with the screenshot)
It will draw all the plots and will give you some nice data to analyze in the Data Window section of TradingView
I'm not completely satisfied with the tool yet but the results are very closed to the dcabtc website mentioned above
If you're trading a very bullish asset class (who said crypto ?), it's very interesting to see what a DCA strategy could bring in term of performance. But DCA is not magic, there is a time component which is the day/week/month you'll start to invest (those who invested in crypto beginning of 2018 in altcoins know what I'm talking about and ..............will hate me for this joke)
5 - What's next ?
As said, the educational post is coming next but not only.
Will probably post a strategy tomorrow using this indicator so that you can compare what's performing best between your trading and a dollar cost average method
I'll publish as a protected source this time a more advanced version of that one including DCA forecasts
6 - Suggested alternative (but I'll you doing it)
If you don't want to have this panel in the bottom with the plots and analyze the results in the data window, you can always create an infopanel like shown here Risk-Reward-InfoPanel/ and display all the data there
Hope you'll like it, like me, love it, love me, tip me :)
____________________________________________________________
Feel free to hit the thumbs up as it shows me that I'm not doing this for nothing and will motivate to deliver more quality content in the future. (Meaning... a few likes only = no indicators = Dave enjoying the beach)
- I'm an offically approved PineEditor/LUA/MT4 approved mentor on codementor. You can request a coaching with me if you want and I'll teach you how to build kick-ass indicators and strategies
Jump on a 1 to 1 coaching with me
- You can also hire for a custom dev of your indicator/strategy/bot/chrome extension/python

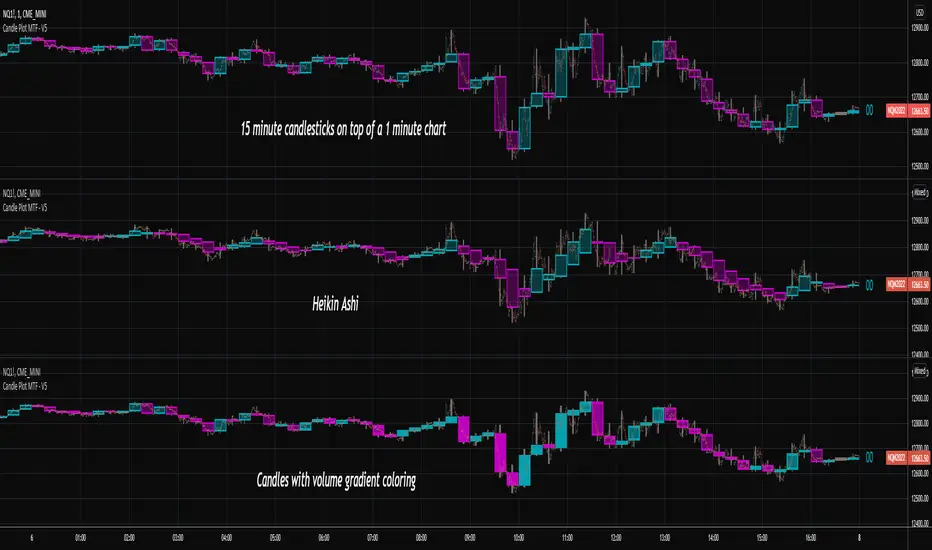
Candlestick Plot MTFPlots the live non-repainting candles for a higher time interval than the chart interval.
Features:
Configuration of the look and feel of the MTF candles.
Live candles update as the price action evolves for the session.
Historical candles can be toggled on/off.
Includes a moving average ribbon that is also MTF, matching the interval chosen.
Please watch this video to understand more:

SMA 50 collector V2Hi everyone
The today script is an upgrade on steroids of my previous SMA 50 collector
Why this script ?
The SMA 50 is known to define a trend. If price is closing above, trend is bullish , if below, trend is bearish.
That's why I like to have all of them in all timeframes on my chart :)
Those are very relevant for all assets class : FOREX, INDEX, STOCKS, CRYPTO, ...
What's the update ?
I added new timeframes and developped a small optimization to get those labels placed on the right hand side of your screen.
"Is it really useful sir ?" Well, you certainly noticed that looking at a chart on tradingview mobile is not ideal (indicators overlapping, indicator names taking too much space and so on...)
When you'll deactivate the indicator name label display from tradingview, you can activate mine which will look way nicer on your mobile (and even Desktop).
This concept was greatly inspired by @scarf :
HOW TO USE IT ?
You can activate/deactivate the SMA50 you (don't) need in the style section of the indicator configuration UI. You'll just have to uncheck/check. Simple right :) ?
See y'all tomorrow for the next indicator or idea. The one for tomorrow should blow your mind as it certainly did when I discovered and optimized it
Enjoy
Dave

Multi Timeframe Moving Average Collection | Swing [aamonkey]This is a Multi Timeframe Moving Average Collection (Swing Edition).
Why use it?
- Spot cluster of MAs on one chart
- See support and resistance
- Spot "freefall zones"
In the default settings you will get:
20, 100 and 200 MA of the 1D, W, and the W chart.
The color indicates significance!
From weaker to stronger support/resistance:
green(1D),yellow(W),red(M)
- Length of the MAs is modifiable
- Timeframes of the MAs is modifiable
- Which MAs you want to see
- Colors
Why use this if there is a Swing edition, that can do the same?
You can use this Swing Edition if you don't want to change between the Swing and Scalp timeframes in the settings.
Just turn on of the two on or off.

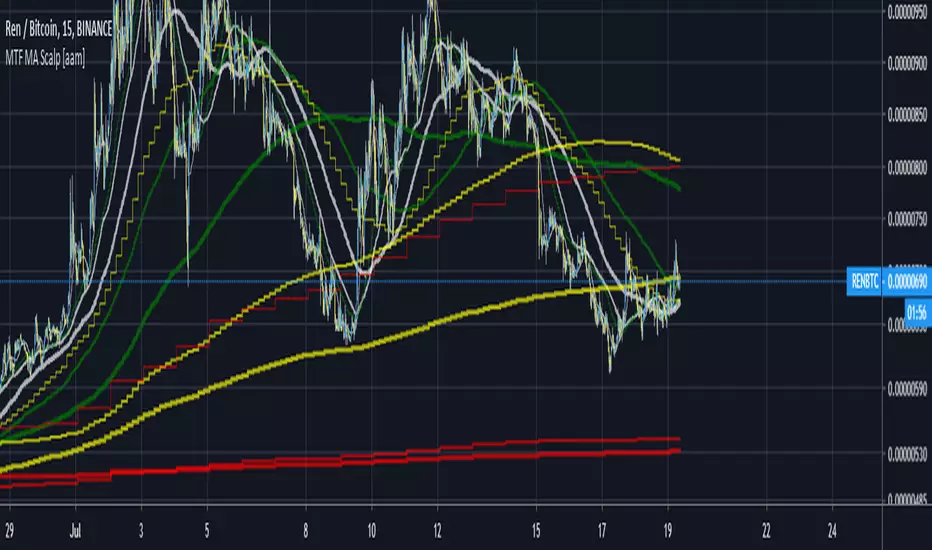
Multi Timeframe Moving Average Collection | Scalp [aamonkey]This is a Multi Timeframe Moving Average Collection (Scalp Edition).
Why use it?
- Spot cluster of MAs on one chart
- See support and resistance
- Spot "freefall zones"
In the default settings you will get:
20, 100 and 200 MA of the 15min, 1h, 4h, and the 1D chart.
The color indicates significance!
From weaker to stronger support/resistance:
white(15min), green(1h),yellow(4h),red(1D)
- Length of the MAs is modifiable
- Timeframes of the MAs is modifiable
- Which MAs you want to see
- Colors
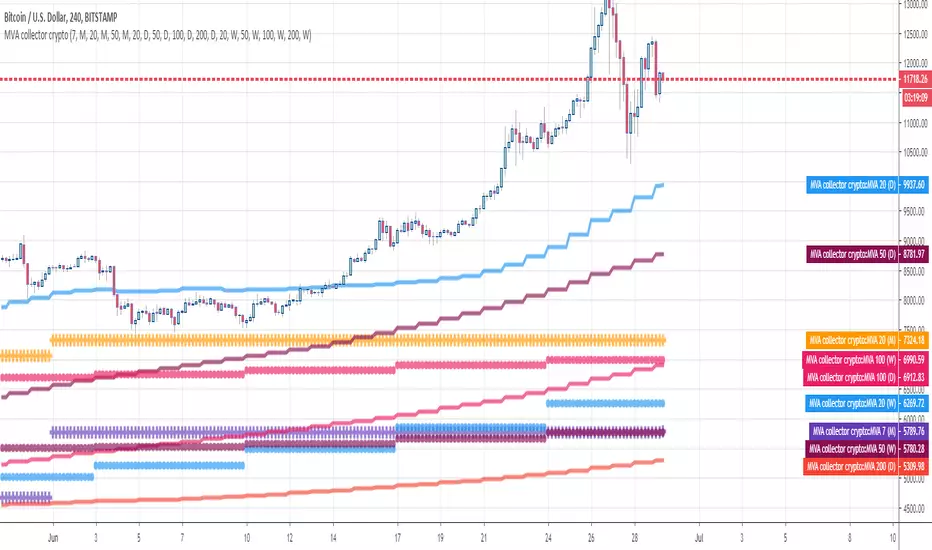
MVA collector cryptoHello Traders
This indicator draw multiple Simple Moving Averages multi-timeframes at once
I use it to define take profit zones for my crypto trading
Hope you'll like it
Enjoy
Dave
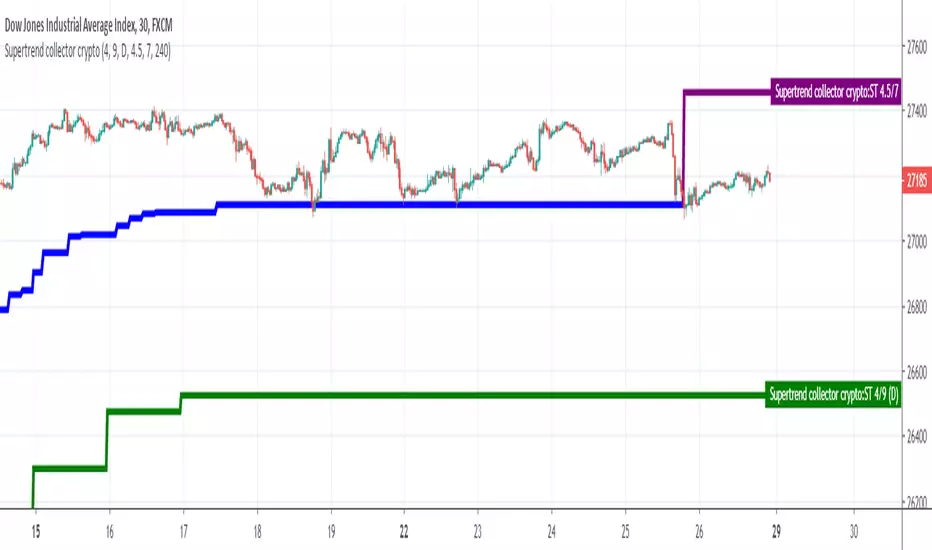
Supertrend collectorHello traders
This is an example of how you can add multiple indicators into a unique one
In this instance, I added two supertrend multitimeframes and draw them on a different timeframe chart
Enjoy
David