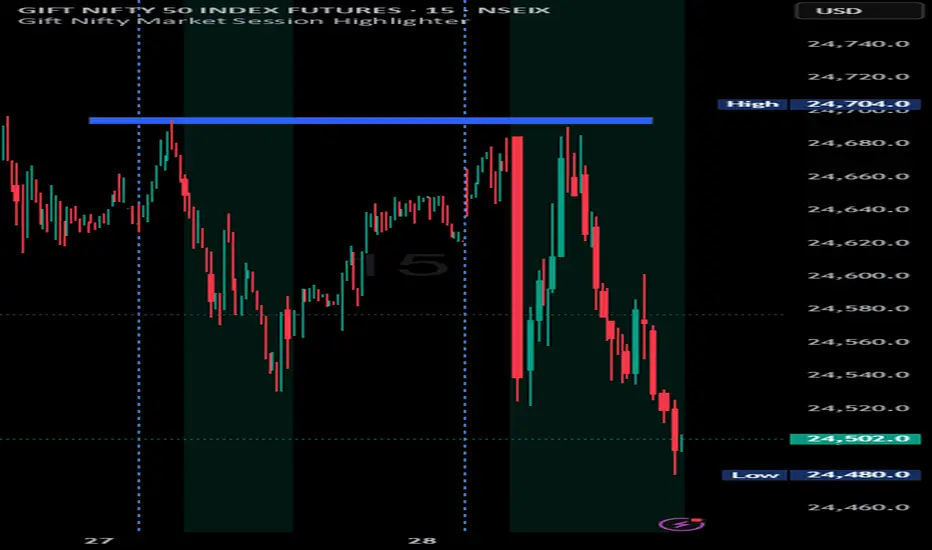
Indian market session on Gift Nifty chartsGift Nifty Market Session Highlighter
This indicator highlights the official Indian market session on Gift Nifty charts — from 9:15 AM to 3:30 PM IST. It shades the background during this time window so traders can instantly identify when the local market is open.
Features:
Marks 9:15 AM to 3:30 PM (IST) session on intraday charts.
Adjustable highlight color and transparency.
Works seamlessly across lower timeframes (1m, 5m, 15m, etc.).
Helps traders align Gift Nifty activity with NSE market hours.
Use Cases:
Quickly distinguish active market hours from overnight or global sessions.
Backtest trading strategies specific to Indian session volatility.
Improv
e focus on expiry-day setups and intraday opportunities.
Disclaimer:
This tool is provided for educational and informational purposes only. It is not financial advice, nor does it guarantee trading success. Always do your own research and consult a licensed financial professional before making investment decisions.
CZAS
20/40/60Displays three consecutive, connected range boxes showing high/low price ranges for customizable periods. Boxes are positioned seamlessly with shared boundaries for continuous price action visualization.
Features
Three Connected Boxes: Red (most recent), Orange (middle), Green (earliest) periods
Customizable Positioning: Set range length and starting offset from current bar
Individual Styling: Custom colors, transparency, and border width for each box
Display Controls: Toggle borders, fills, and line visibility
Use Cases
Range Analysis: Compare volatility across time periods, spot breakouts
Support/Resistance: Use box boundaries as potential S/R levels
Market Structure: Visualize recent price development and trend patterns
Key Settings
Range Length: Bars per box (default: 20)
Starting Offset: Bars back from current to position boxes (default: 0)
Style Options: Colors, borders, and visibility controls for each box
Perfect for traders analyzing consecutive price ranges and comparing current conditions to recent historical periods.

Sessions [New_ProfitEfex]This script is use for displaying session in a very attractive an clarity way
You can give it a try for free

Time-Decaying Percentile Oscillator [BackQuant]Time-Decaying Percentile Oscillator
1. Big-picture idea
Traditional percentile or stochastic oscillators treat every bar in the look-back window as equally important. That is fine when markets are slow, but if volatility regime changes quickly yesterday’s print should matter more than last month’s. The Time-Decaying Percentile Oscillator attempts to fix that blind spot by assigning an adjustable weight to every past price before it is ranked. The result is a percentile score that “breathes” with market tempo much faster to flag new extremes yet still smooth enough to ignore random noise.
2. What the script actually does
Build a weight curve
• You pick a look-back length (default 28 bars).
• You decide whether weights fall Linearly , Exponentially , by Power-law or Logarithmically .
• A decay factor (lower = faster fade) shapes how quickly the oldest price loses influence.
• The array is normalised so all weights still sum to 1.
Rank prices by weighted mass
• Every close in the window is paired with its weight.
• The pairs are sorted from low to high.
• The cumulative weight is walked until it equals your chosen percentile level (default 50 = median).
• That price becomes the Time-Decayed Percentile .
Find dispersion with robust statistics
• Instead of a fragile standard deviation the script measures weighted Median-Absolute-Deviation about the new percentile.
• You multiply that deviation by the Deviation Multiplier slider (default 1.0) to get a non-parametric volatility band.
Build an adaptive channel
• Upper band = percentile + (multiplier × deviation)
• Lower band = percentile – (multiplier × deviation)
Normalise into a 0-100 oscillator
• The current close is mapped inside that band:
0 = lower band, 50 = centre, 100 = upper band.
• If the channel squeezes, tiny moves still travel the full scale; if volatility explodes, it automatically widens.
Optional smoothing
• A second-stage moving average (EMA, SMA, DEMA, TEMA, etc.) tames the jitter.
• Length 22 EMA by default—change it to tune reaction speed.
Threshold logic
• Upper Threshold 70 and Lower Threshold 30 separate standard overbought/oversold states.
• Extreme bands 85 and 15 paint background heat when aggressive fade or breakout trades might trigger.
Divergence engine
• Looks back twenty bars.
• Flags Bullish divergence when price makes a lower low but oscillator refuses to confirm (value < 40).
• Flags Bearish divergence when price prints a higher high but oscillator stalls (value > 60).
3. Component walk-through
• Source – Any price series. Close by default, switch to typical price or custom OHLC4 for futures spreads.
• Look-back Period – How many bars to rank. Short = faster, long = slower.
• Base Percentile Level – 50 shows relative position around the median; set to 25 / 75 for quartile tracking or 90 / 10 for extreme tails.
• Deviation Multiplier – Higher values widen the dynamic channel, lowering whipsaw but delaying signals.
• Decay Settings
– Type decides the curve shape. Exponential (default 1.16) mimics EMA logic.
– Factor < 1 shrinks influence faster; > 1 spreads influence flatter.
– Toggle Enable Time Decay off to compare with classic equal-weight stochastic.
• Smoothing Block – Choose one of seven MA flavours plus length.
• Thresholds – Overbought / Oversold / Extreme levels. Push them out when working on very mean-reverting assets like FX; pull them in for trend monsters like crypto.
• Display toggles – Show or hide threshold lines, extreme filler zones, bar colouring, divergence labels.
• Colours – Bullish green, bearish red, neutral grey. Every gradient step is automatically blended to generate a heat map across the 0-100 range.
4. How to read the chart
• Oscillator creeping above 70 = market auctioning near the top of its adaptive range.
• Fast poke above 85 with no follow-through = exhaustion fade candidate.
• Slow grind that lives above 70 for many bars = valid bullish trend, not a fade.
• Cross back through 50 shows balance has shifted; treat it like a micro trend change.
• Divergence arrows add extra confidence when you already see two-bar reversal candles at range extremes.
• Background shading (semi-transparent red / green) warns of extreme states and throttles your position size.
5. Practical trading playbook
Mean-reversion scalps
1. Wait for oscillator to reach your desired OB/ OS levels
2. Check the slope of the smoothing MA—if it is flattening the squeeze is mature.
3. Look for a one- or two-bar reversal pattern.
4. Enter against the move; first target = midline 50, second target = opposite threshold.
5. Stop loss just beyond the extreme band.
Trend continuation pullbacks
1. Identify a clean directional trend on the price chart.
2. During the trend, TDP will oscillate between midline and extreme of that side.
3. Buy dips when oscillator hits OS levels, and the same for OB levels & shorting
4. Exit when oscillator re-tags the same-side extreme or prints divergence.
Volatility regime filter
• Use the Enable Time Decay switch as a regime test.
• If equal-weight oscillator and decayed oscillator diverge widely, market is entering a new volatility regime—tighten stops and trade smaller.
Divergence confirmation for other indicators
• Pair TDP divergence arrows with MACD histogram or RSI to filter false positives.
• The weighted nature means TDP often spots divergence a bar or two earlier than standard RSI.
Swing breakout strategy
1. During consolidation, band width compresses and oscillator oscillates around 50.
2. Watch for sudden expansion where oscillator blasts through extreme bands and stays pinned.
3. Enter with momentum in breakout direction; trail stop behind upper or lower band as it re-expands.
6. Customising decay mathematics
Linear – Each older bar loses the same fixed amount of influence. Intuitive and stable; good for slow swing charts.
Exponential – Influence halves every “decay factor” steps. Mirrors EMA thinking and is fastest to react.
Power-law – Mid-history bars keep more authority than exponential but oldest data still fades. Handy for commodities where seasonality matters.
Logarithmic – The gentlest curve; weight drops sharply at first then levels off. Mimics how traders remember dramatic moves for weeks but forget ordinary noise quickly.
Turn decay off to verify the tool’s added value; most users never switch back.
7. Alert catalogue
• TD Overbought / TD Oversold – Cross of regular thresholds.
• TD Extreme OB / OS – Breach of danger zones.
• TD Bullish / Bearish Divergence – High-probability reversal watch.
• TD Midline Cross – Momentum shift that often precedes a window where trend-following systems perform.
8. Visual hygiene tips
• If you already plot price on a dark background pick Bullish Color and Bearish Color default; change to pastel tones for light themes.
• Hide threshold lines after you memorise the zones to declutter scalping layouts.
• Overlay mode set to false so the oscillator lives in its own panel; keep height about 30 % of screen for best resolution.
9. Final notes
Time-Decaying Percentile Oscillator marries robust statistical ranking, adaptive dispersion and decay-aware weighting into a simple oscillator. It respects both recent order-flow shocks and historical context, offers granular control over responsiveness and ships with divergence and alert plumbing out of the box. Bolt it onto your price action framework, trend-following system or volatility mean-reversion playbook and see how much sooner it recognises genuine extremes compared to legacy oscillators.
Backtest thoroughly, experiment with decay curves on each asset class and remember: in trading, timing beats timidity but patience beats impulse. May this tool help you find that edge.

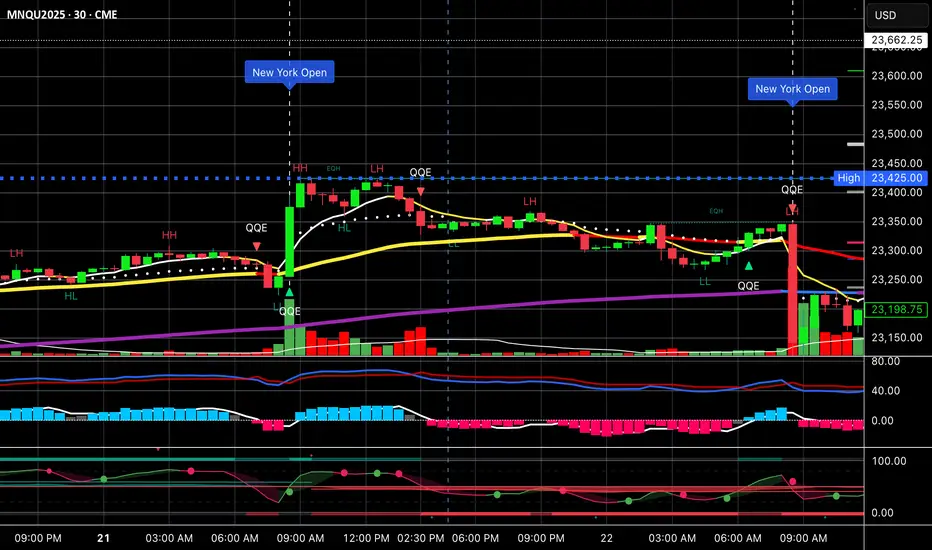
Vertical Time Marker Configurable (VTMC)# Vertical Time Marker Configurable (VTMC)
## Overview
The Vertical Time Marker Configurable (VTMC) is a powerful PineScript v6 indicator designed to help traders quickly identify key market times across their entire chart history. Instead of hovering over candles to check timestamps, VTMC draws clear vertical lines with customizable labels at your specified times, making it easy to spot important market sessions, news events, or personal trading windows at a glance.
## Key Features
### ⏰ Flexible Time Selection
- Set any time using an intuitive time picker (defaults to 8:30 AM Central Time)
- Automatically draws lines at your specified time across all historical data
- Perfect for marking market opens, closes, news releases, or personal trading times
### 🎨 Full Visual Customization
- **Line Color**: Choose any color (defaults to white for maximum visibility)
- **Line Style**: Solid, dashed, or dotted options
- **Line Width**: Adjustable from 1-10 pixels
- **Opacity Control**: Precise opacity slider (0-100%) for both line and text
### 🏷️ Smart Text Labels
- **Preset Options**: New York Open, New York Close, London Open, London Close, Asia Open, Asia Close
- **Custom Labels**: Enter any text for personalized marking (news events, trading windows, etc.)
- **Configurable Text**: Adjustable size (8-20px), color, and opacity
- **Smart Positioning**: Text appears just above the price action for clear visibility
### 📊 Professional Display
- Lines extend fully from top to bottom of chart
- Clean, non-intrusive design that doesn't clutter your analysis
- Works on any timeframe and market
- Historical lines persist across all chart data
## Perfect For
### Market Session Traders
- Mark key session opens and closes
- Identify overlap periods between major markets
- Track session-specific price behavior patterns
### News Traders
- Mark important economic releases (FOMC, NFP, etc.)
- Create visual reminders for scheduled events
- Track market reaction patterns around news times
### Institutional Flow Traders
- Identify key institutional activity times
- Mark order block formation periods
- Track smart money movement windows
### Personal Trading Systems
- Mark your optimal trading hours
- Create visual discipline for trading windows
- Track performance during specific time periods
## Why VTMC?
Unlike hardcoded session indicators that only work for specific markets, VTMC gives you complete flexibility to mark ANY time that matters to your trading strategy. Whether you're tracking "MY Trading Window" from 9:30-10:30 AM or marking custom news events, VTMC adapts to your specific needs.
The indicator eliminates the constant need to hover over candles to check times, instead providing instant visual reference points across your entire chart. This makes pattern recognition, backtesting, and trade timing significantly more efficient.
## Usage Tips
- Use multiple instances for different time zones or events
- Combine with other indicators for comprehensive market timing
- Customize colors to match your chart theme
- Use custom labels for personalized trading reminders
*Built with precision in PineScript v6 for reliable performance and modern TradingView compatibility.*
Custom Opening TimesThis indicator displays custom opening levels on your chart. Define multiple opening times, each with its own customizable style. Display these levels as horizontal lines at the opening price, or as vertical lines to mark the opening time.
Custom Opening Times
4 Independent Groups with 4 custom opening levels each
Set any custom opening time (displayed in New York Local Time)
Choose between Opening Price lines, Vertical time markers, or Both
Cutoff Times: Stop extending lines after specified times
Higher Timeframe Levels
5 Configurable HTF levels supporting any timeframe
Display opening prices from Daily, Weekly, Monthly, Quarterly, and custom timeframes
Show Previous High/Low levels from higher timeframes

Gann Single Square Swing Trading System with Gann AnglesGann Single Square Swing Trading System
This script automatically detects "squares" - geometric patterns where price movement equals time movement. When price moves the same distance as the number of bars (time), it creates powerful support/resistance levels based on Gann theory.
Key Visual Elements
• Box: The detected square pattern
• Dark Blue Line (50%): Most important trading level
• Green Lines: Profit target levels (125%, 150%)
• Red Lines: Stop loss levels (-25%, -50%)
• Colored Angle Lines: Gann angles for trend direction
• Quality Score: Blue label showing setup strength (aim for 70%+)
Simple Trading Rules
LONG Trades (Green 🟢 Square)
1. Entry: Buy when price touches the dark blue 50% line from above
2. Stop Loss: Place below the red -25% line
3. Take Profit: Exit at green 125% line (first target) or 150% line (second target)
SHORT Trades (Red 🔴 Square)
1. Entry: Sell when price touches the dark blue 50% line from below
2. Stop Loss: Place above the red -25% line
3. Take Profit: Exit at green 125% line (first target) or 150% line (second target)
Entry Checklist
✅ Square quality score > 70%
✅ Price touches 50% level (dark blue line)
✅ Volume above average (if volume filter enabled)
✅ Clear square formation visible
Alerts
The script generates automatic alerts when price reaches the 50% trading level. Enable alerts in TradingView to get notified of setups.
Bottom Line: Wait for the alert → Check quality score → Enter at 50% level → Set stop at red line → Take profit at green line.

Angled Gann Time-Price Squares with S/RThis is a Pine Script indicator that implements Angled Gann Time-Price Squares based on W.D. Gann's trading theory. Here's what it does:
Core Functionality
Detects pivot highs and lows using a configurable lookback period
Creates angled squares by connecting pivot points to current price action when specific geometric conditions are met
Validates square formation by checking if the price movement follows proper Gann angles (typically 45°, 135°, etc.) within a tolerance range
Key Features
Real-time square tracking: Shows both completed squares and forming squares in progress
Support/Resistance levels: Automatically generates S/R lines from:
Square edge extensions
Diagonal extensions (pivot centers)
Quarter/half levels within squares (25%, 50%, 75%)
Visual feedback: Color-coded squares (green for up, red for down, orange for forming)
Projection lines: Predicts where squares might complete based on Gann angle theory
Gann Theory Application
The indicator follows Gann's principle that time and price move in geometric harmony. It looks for price movements that form perfect squares when plotted on a chart, where the diagonal of the square represents the natural flow of price and time at specific angles.
The generated support/resistance levels are particularly valuable because they're based on completed geometric patterns rather than just horizontal price levels, making them potentially more significant according to Gann methodology.

Non-Lagging Longevity Zones [BigBeluga]🔵 OVERVIEW
A clean, non-lagging system for identifying price zones that persist over time—ranking them visually based on how long they survive without being invalidated.
Non-Lagging Longevity Zones uses non-lagging pivots to automatically build upper and lower zones that reflect key resistance and support. These zones are kept alive as long as price respects them and are instantly removed when invalidated. The indicator assigns a unique lifespan label to each zone in Days (D), Months (M), or Years (Y), providing instant context for historical relevance.
🔵 CONCEPTS
Non-Lag Pivot Detection: Detects upper and lower pivots using non-lagging swing identification (highest/lowest over length period).
h = ta.highest(len)
l = ta.lowest(len)
high_pivot = high == h and high < h
low_pivot = low == l and low > l
Longevity Ranking: Zones are preserved as long as price doesn't breach them. Levels that remain intact grow in visual intensity.
Time-Based Weighting: Each zone is labeled with its lifespan in days , emphasizing how long it has survived.
duration = last_bar_index - start
days_ = int(duration*(timeframe.in_seconds("")/60/60/24))
days = days_ >= 365 ? int(days_ / 365) : days_ >= 30 ? int(days_ / 30) : days_
marker = days_ >= 365 ? " Y" : days_ >= 30 ? " M" : " D"
Dynamic Coloring: Older zones are drawn with stronger fill, while newer ones appear fainter—making it easy to assess significance.
Self-Cleaning Logic: If price invalidates a zone, it’s instantly removed, keeping the chart clean and focused.
🔵 FEATURES
Upper and Lower Zones: Auto-detects valid high/low pivots and plots horizontal zones with ATR-based thickness.
Real-Time Validation: Zones are extended only if price stays outside them—giving precise control zones.
Gradient Fill Intensity: The longer a level survives, the more opaque the fill becomes.
Duration-Based Labeling: Time alive is shown at the root of each zone:
• D – short-term zones
• M – medium-term structure
• Y – long-term legacy levels
Smart Zone Clearing: Zones are deleted automatically once invalidated by price, keeping the display accurate.
Efficient Memory Handling: Keeps only the 10 most recent valid levels per side for optimal performance.
🔵 HOW TO USE
Track durable S/R zones that survived price tests without being breached.
Use longer-lived zones as high-confidence confluence areas for entries or targets.
Observe fill intensity to judge structural importance at a glance .
Layer with volume or momentum tools to confirm bounce or breakout probability.
Ideal for swing traders, structure-based traders, or macro analysis.
🔵 CONCLUSION
Non-Lagging Longevity Zones lets the market speak for itself—by spotlighting levels with proven survival over time. Whether you're trading trend continuation, mean reversion, or structure-based reversals, this tool equips you with an immediate read on what price zones truly matter—and how long they've stood the test of time.

Gann Octave 8 - Professional V 1.0Gann Octave 8 Indicator:
Core Concept: This indicator divides the price range between highest high and lowest low into 8 equal parts (octaves), creating support/resistance levels based on W.D. Gann's trading principles.
Key Components:
1. Price Range Calculation:
o Finds highest high and lowest low over a lookback period (default 50 bars)
o Divides this range into 8 equal segments (12.5% each)
2. 8 Octave Levels:
o 0% (Low Support) - Strongest support
o 12.5%, 25%, 37.5% - Minor levels
o 50% (CRITICAL) - Most important level
o 62.5%, 75%, 87.5% - Minor levels
o 100% (High Resistance) - Strongest resistance
3. Gann Angles: Projects trend lines from high/low points at various angles (1x1, 2x1, 1x2, etc.)
4. Visual Features:
o Color-coded levels
o Information table showing current position
o Background highlighting when near critical levels
o Trend analysis (bullish/bearish zones)
Trading Strategy
Entry Signals:
BULLISH TRADES:
• Price crosses above 50% level → Strong buy signal
• Price bounces from 25% or 37.5% levels → Support bounce
• Price in upper zone (above 50%) → Bullish bias
BEARISH TRADES:
• Price crosses below 50% level → Strong sell signal
• Price rejects at 75% or 87.5% levels → Resistance rejection
• Price in lower zone (below 50%) → Bearish bias
Key Trading Rules:
1. 50% Level is Critical: Most important for trend direction
2. Zone Trading:
o Above 50% = Bullish zone (look for longs)
o Below 50% = Bearish zone (look for shorts)
3. Strength Levels:
o Above 75% or below 25% = Strong moves
o Near 100% (high) or 0% (low) = Extreme levels
Risk Management:
• Stop Loss: Place below previous octave level
• Take Profit: Target next octave level
• Position Size: Reduce size near extreme levels (0%, 100%)
Example Trade:
If price breaks above 50% level:
• Entry: Long position
• Stop: Below 37.5% level
• Target: 75% level
• Risk: Monitor for rejection at resistance levels
The indicator works best in trending markets and helps identify high-probability reversal zones.
Works for both Stocks & Derivatives. Experiment with code and share your feedback in comments..

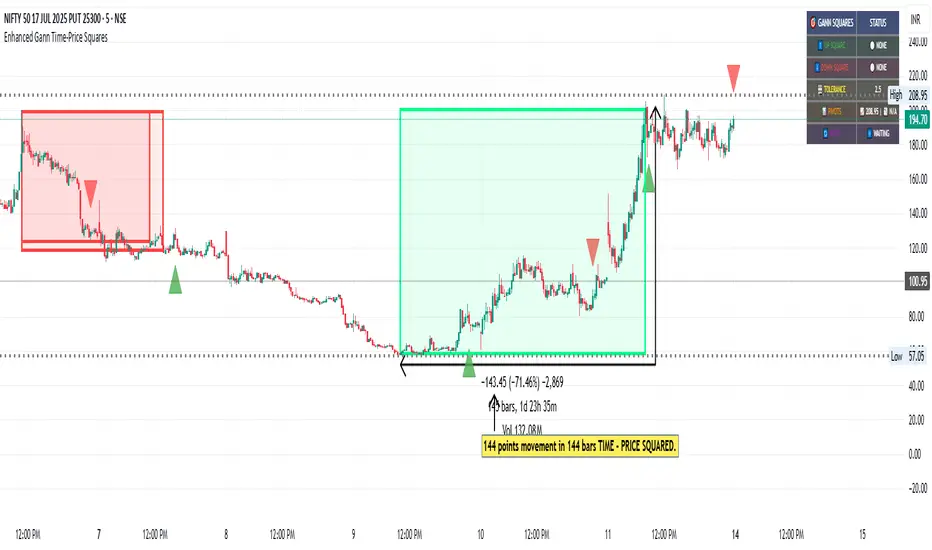
Enhanced Gann Time-Price SquaresEnhanced Gann Time-Price Squares Indicator
A comprehensive Pine Script indicator that identifies and visualizes W.D. Gann's time-price square formations on your charts. This tool helps traders spot potential market turning points where time and price movements align according to Gann's legendary market theories.
Key Features:
Automatic Square Detection - Identifies completed squares where price movement equals time movement
Future Projections - Shows forming squares with projected completion points
Pivot Integration - Automatically detects pivot highs/lows as square starting points
Visual Clarity - Clean box outlines with customizable colors and styles
Smart Filtering - Prevents overlapping squares and includes minimum move thresholds
Real-time Status - Information table showing current square formations
How to Use:
The indicator draws boxes when price moves from pivot points equal the time elapsed (number of bars). Green squares indicate upward movements, red squares show downward movements. Dashed lines show forming squares, while dotted lines project where they might complete.
Settings:
Adjust pivot sensitivity and minimum price moves
Customize tolerance for time-price matching
Toggle projections, labels, and visual elements
Fine-tune colors and line styles
Perfect for Gann theory practitioners and traders looking for time-based market analysis. The squares often coincide with significant support/resistance levels and potential reversal points.
Compatible with all timeframes and instruments.
More updates to follow
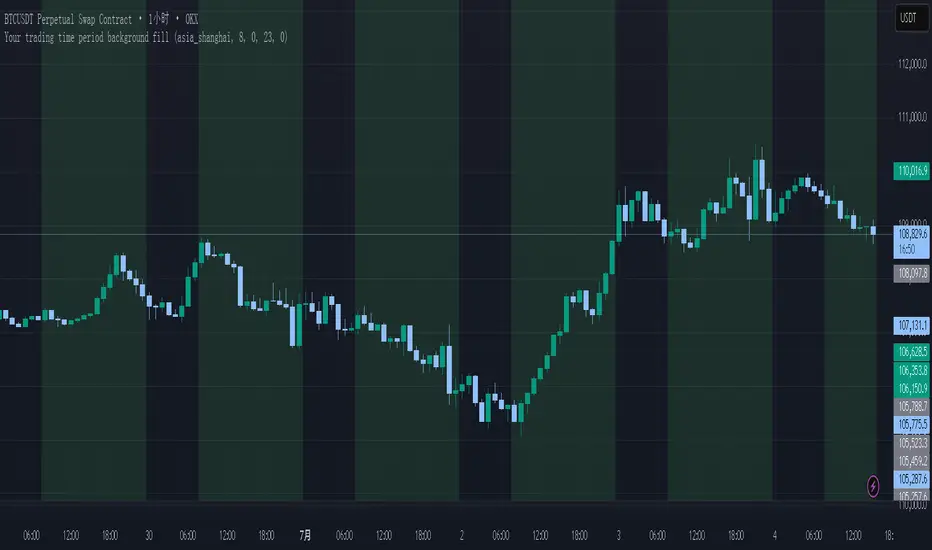
Your trading time period background fillThis script allows you to add background highlights to charts during any regional trading session, customize your own trading time, and is precise and customizable yet simple and easy to use, making it more convenient to review transactions.
Support global mainstream time zones: The drop-down list includes 30 commonly used IANA time zones (default is Asia/Shanghai) (such as Asia/Shanghai, America/New_York, Europe/London, etc.), one-click switching, no need to manually calculate the time difference.
Fully localized time input: "Start hour/minute" and "End hour/minute" are filled in with the local time of the selected time zone. The end hour defaults to 23:00 and can be adjusted to 0-23 at will.
Accurate time difference splitting: The script internally splits the time zone offset into whole hours and remainder minutes (supports half-hour zones, such as UTC+5:30), and ensures that all parameters are integers when calling timestamp to avoid errors.
Dynamic background rendering: Each K-line is judged according to the UTC timestamp whether it falls within the set range. If it meets the time period, it will be marked with a semi-transparent green background, and it will return to its original state after crossing the time period, helping you to identify the opening, closing or active period of any market at a glance.
Wide range of scenarios: It can be used for time-sharing highlighting of all-weather varieties of foreign exchange and cryptocurrency, and can also be used in conjunction with backtesting and timing strategies to only send signals during the active period of the target market, greatly improving trading efficiency and strategy accuracy.
Just select the region and set the time, and the script will automatically complete all complex time zone conversions and drawing, allowing you to focus on the transaction itself.
Simple Candle Countdown TimerDescription:
This lightweight and customizable TradingView indicator displays a real-time countdown timer for the current candle directly on your chart. The timer updates every second and shows the time remaining until the current candle closes, in the format MM:SS.
🔧 Features:
Adjustable X/Y offset to position the timer anywhere on the chart
Customizable text color, background color, and text size
Clear and minimal design for easy visibility
Ideal for scalpers, intraday traders, or anyone who wants precise awareness of candle close timing.

Time LevelsTime Levels is a customizable TradingView indicator designed to mark critical intraday price levels based on specific time inputs. This tool helps traders identify significant Open/High/Low/Close (OHLC) levels, support & resistance (S&R) zones, and potential Judas Swing manipulation points—aligned with selected timeframes and adjusted to any time zone via UTC offset.
🔧 Key Features:
OHLC/OLHC Levels: Automatically draws horizontal lines at the candle’s open price for up to four specified time points. Ideal for marking session opens, closes, or key intraday levels.
Support & Resistance Zones: Highlights two time-based S&R levels that can help identify discount and premium pricing zones.
Judas Swing Detection: Marks potential liquidity grab zones (Judas Swings) at three user-defined times, assisting in identifying manipulation and smart money entry points.
Global Timezone Support: Includes a UTC offset input to align levels accurately with your trading session, regardless of your location.
Full Customization: Personalize the color, style (solid, dashed, dotted), and thickness of each line independently for OHLC, S&R, and Judas levels.
🛠️ Use Cases:
New York / London open price tracking
ICT-based SMC level marking
Predefined time-based liquidity level visualizations
Institutional-level price reactions (e.g., during specific market opens)
This indicator is best suited for intraday and short-term (especially ICT) traders looking to bring precision and consistency into their technical analysis framework.

Velez Price Action Signals (with 20 & 200 SMA)Velez Price Action Signals – With 20 & 200 SMA Overlay
This TradingView Pine Script is a clean and powerful reversal signal tool inspired by Oliver Velez’s price action philosophy, enhanced with trend context via two Simple Moving Averages.
🔍 Signal Logic
Buy Signal:
Current candle sweeps below the previous 5-bar low (liquidity grab).
Candle is bullish (close > open).
The lower wick is significantly larger than the body (e.g. ratio > 1.5).
Sell Signal:
Current candle sweeps above the previous 5-bar high.
Candle is bearish (close < open).
The upper wick is significantly larger than the body.
Signals appear as BUY/SELL labels on the chart (non-repainting).

Yearly History Calendar-Aligned Price up to 10 Years)Overview
This indicator helps traders compare historical price patterns from the past 10 calendar years with the current price action. It overlays translucent lines (polylines) for each year’s price data on the same calendar dates, providing a visual reference for recurring trends. A dynamic table at the top of the chart summarizes the active years, their price sources, and history retention settings.
Key Features
Historical Projections
Displays price data from the last 10 years (e.g., January 5, 2023 vs. January 5, 2024).
Price Source Selection
Choose from Open, Low, High, Close, or HL2 ((High + Low)/2) for historical alignment.
The selected source is shown in the legend table.
Bulk Control Toggles
Show All Years : Display all 10 years simultaneously.
Keep History for All : Preserve historical lines on year transitions.
Hide History for All : Automatically delete old lines to update with current data.
Individual Year Settings
Toggle visibility for each year (-1 to -10) independently.
Customize color and line width for each year.
Control whether to keep or delete historical lines for specific years.
Visual Alignment Aids
Vertical lines mark yearly transitions for reference.
Polylines are semi-transparent for clarity.
Dynamic Legend Table
Shows active years, their price sources, and history status (On/Off).
Updates automatically when settings change.
How to Use
Configure Settings
Projection Years : Select how many years to display (1–10).
Price Source : Choose Open, Low, High, Close, or HL2 for historical alignment.
History Precision : Set granularity (Daily, 60m, or 15m).
Daily (D) is recommended for long-term analysis (covers 10 years).
60m/15m provides finer precision but may only cover 1–3 years due to data limits.
Adjust Visibility & History
Show Year -X : Enable/disable specific years for comparison.
Keep History for Year -X : Choose whether to retain historical lines or delete them on new year transitions.
Bulk Controls
Show All Years : Display all 10 years at once (overrides individual toggles).
Keep History for All / Hide History for All : Globally enable/disable history retention for all years.
Customize Appearance
Line Width : Adjust polyline thickness for better visibility.
Colors : Assign unique colors to each year for easy identification.
Interpret the Legend Table
The table shows:
Year : Label (e.g., "Year -1").
Source : The selected price type (e.g., "Close", "HL2").
Keep History : Indicates whether lines are preserved (On) or deleted (Off).
Tips for Optimal Use
Use Daily Timeframes for Long-Term Analysis :
Daily (1D) allows 10+ years of data. Smaller timeframes (60m/15m) may have limited historical coverage.
Compare Recurring Patterns :
Look for overlaps between historical polylines and current price to identify potential support/resistance levels.
Customize Colors & Widths :
Use contrasting colors for years you want to highlight. Adjust line widths to avoid clutter.
Leverage Global Toggles :
Enable Show All Years for a quick overview. Use Keep History for All to maintain continuity across transitions.
Example Workflow
Set Up :
Select Projection Years = 5.
Choose Price Source = Close.
Set History Precision = 1D for long-term data.
Customize :
Enable Show Year -1 to Show Year -5.
Assign distinct colors to each year.
Disable Keep History for All to ensure lines update on year transitions.
Analyze :
Observe how the 2023 close prices align with 2024’s price action.
Use vertical lines to identify yearly boundaries.
Common Questions
Why are some years missing?
Ensure the chart has sufficient historical data (e.g., daily charts cover 10 years, 60m/15m may only cover 1–3 years).
How do I update the data?
Adjust the Price Source or toggle years/history settings. The legend table updates automatically.

Time-based LiquidityThis indicator automatically marks important time-based liquidity levels on your chart, helping you stay aware of where major price reactions may occur and the market is forced to show its hand.
Key Features:
Previous Month’s, Week’s, and Day’s Highs and Lows: Displays PMH/PML, PWH/PWL, and PDH/PDL — key reference points where liquidity often accumulates.
Intraday Session Highs and Lows: Divides the trading day into quarters (00:00–06:00, 06:00–12:00, etc. following Day’s Quarterly Theory) and tracks session highs and lows dynamically across these periods.
Current Session 90-Minute Quarters: Splits the active session into 90-minute intervals to highlight short-term liquidity structures and potential reaction zones.
Level Alerts: Tracks when each liquidity level is reached and enables customizable alerts so you don’t miss important price movements.
Use Case:
This tool provides an organized, time-based framework for identifying where liquidity is likely to concentrate across different timeframes and intraday cycles. Use these levels for forming bias, planning entries, exits, or anticipating price reactions at key points in the market structure.
Customization Options:
Enable/disable liquidity levels to display (Daily, Weekly, Monthly, Sessions, Session Quarters)
Customize the appearance of each level (color, style, line width)
Enable or disable tracking and alerts for level interactions

Zig Zag Trend Metrics“ Zig Zag Trend Metrics ” is a highly versatile indicator, built on the classic Zig Zag concept and thoughtfully designed for technical traders seeking a deeper, more structured view of market dynamics. This tool identifies significant swing highs and lows, classifies them, and annotates each with key metrics, offering a precise snapshot of each movement. It enhances visual analysis by drawing connecting lines that outline the flow of market structure, making trend progression and reversals instantly recognizable. Beyond visual mapping, it features a compact, real-time statistics table that calculates the average price and time deltas for both bullish and bearish swings, giving traders deep insights into trend momentum and rhythm. With extensive customization options, this indicator adapts seamlessly to vast trading styles or chart setups, empowering traders to spot patterns, evaluate trend strength, and make more confident, data-backed decisions.
❖ FEATURES
✦ Automatic Swing Detection
At its core, this indicator automatically identifies swing highs and lows based on a customizable lookback period (default: 10 bars).
✦ Labeling Swing Points
Each swing is visualized with a label that includes:
Swing Classification : “HH” (Higher High), “LH” (Lower High), “LL” (Lower Low), or “HL” (Higher Low).
Price Difference : Displayed in percentage or absolute value from the previous opposite swing.
Time Difference : The number of bars since the previous swing of the opposite type.
These labels offer traders clear, immediate insight into price movements and structural changes.
✦ Visual Lines
The indicator draws three types of lines:
Bullish Lines: Connect recent swing lows to new swing highs, indicating uptrends.
Bearish Lines: Connect recent swing highs to new swing lows, indicating downtrends.
Range Lines: Connect consecutive highs or lows to outline price channels.
Each line type can be color-coded and customized for visibility.
✦ Statistics Table
An on-screen metrics table provides a live summary of trends. Script uses Relative Averaging to smooth price and time changes. This prevents outliers from distorting the data and provides a more reliable sense of typical swing behavior.
Uptrend Metrics: Shows average price and time differences from recent bullish swings.
Downtrend Metrics: Shows the same for bearish swings.
🛠️ Customization Options
Ability to tailor the indicator to suit their strategy and aesthetic preferences:
Swing Period: Adjust sensitivity to short- or long-term swings.
Color Settings: Customize line and label colors.
Label Display: Choose between absolute or percentage price differences.
Table Settings: Modify size, location, or visibility.
This makes the indicator highly flexible and useful across various timeframes and assets.

Personal Time Zone: Days of WeekThis is probably the simplest indicator I have ever made.
It just gives you a the days of weeks in your specified time zone and puts the day on the first bar in your time zone.
You can use UTC time format or named time zones like the default.
Just for fun I tried to give it symbols that sort of relate the old gods that the days of week were named after and even colors that one could argue match, but it was all in fun because it was so simple I felt I had to add something.
Enjoy.

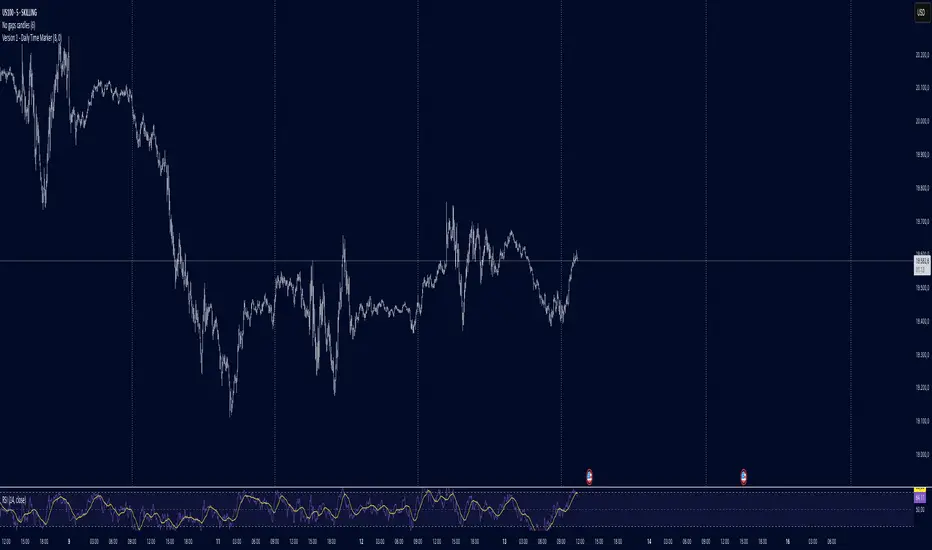
Daily Time MarkerThis TradingView indicator draws thin, white, dashed vertical lines on the chart at a user-defined time each day. The indicator takes into account Daylight Saving Time (DST) adjustments, ensuring the correct time is displayed throughout the year.
Key Features:
✅ Daily Vertical Markers:
Displays vertical dashed lines from Monday to Friday at the selected time.
The lines extend infinitely in both directions.
✅ Historical & Future Projection:
Shows lines 15 days into the past and 5 days into the future for better visualization of key time levels.
✅ DST Adjustment:
Automatically adjusts between summer and winter time , ensuring the correct hour is displayed.
This indicator is useful for traders who rely on specific time-based events, such as market opens or key trading sessions.
Quarterly Theory ICT 02 [TradingFinder] True Open Session 90 Min🔵 Introduction
The Quarterly Theory ICT indicator is an advanced analytical system built on ICT (Inner Circle Trader) concepts and fractal time. It divides time into four quarters (Q1, Q2, Q3, Q4), and is designed based on the consistent repetition of these phases across all trading timeframes (annual, monthly, weekly, daily, and even shorter trading sessions).
Each cycle consists of four distinct phases: the first phase (Q1) is the Accumulation phase, characterized by price consolidation; the second phase (Q2), known as Manipulation or Judas Swing, is marked by initial false movements indicating a potential shift; the third phase (Q3) is Distribution, where price volatility peaks; and the fourth phase (Q4) is Continuation/Reversal, determining whether the previous trend continues or reverses.
🔵 How to Use
The central concept of this strategy is the "True Open," which refers to the actual starting point of each time cycle. The True Open is typically defined at the beginning of the second phase (Q2) of each cycle. Prices trading above or below the True Open serve as a benchmark for predicting the market's potential direction and guiding trading decisions.
The practical application of the Quarterly Theory strategy relies on accurately identifying True Open points across various timeframes.
True Open points are defined as follows :
Yearly Cycle :
Q1: January, February, March
Q2: April, May, June (True Open: April Monthly Open)
Q3: July, August, September
Q4: October, November, December
Monthly Cycle :
Q1: First Monday of the month
Q2: Second Monday of the month (True Open: Daily Candle Open price on the second Monday)
Q3: Third Monday of the month
Q4: Fourth Monday of the month
Weekly Cycle :
Q1: Monday
Q2: Tuesday (True Open: Daily Candle Open Price on Tuesday)
Q3: Wednesday
Q4: Thursday
Daily Cycle :
Q1: 18:00 - 00:00 (Asian session)
Q2: 00:00 - 06:00 (True Open: Start of London Session)
Q3: 06:00 - 12:00 (NY AM)
Q4: 12:00 - 18:00 (NY PM)
90 Min Asian Session :
Q1: 18:00 - 19:30
Q2: 19:30 - 21:00 (True Open at 19:30)
Q3: 21:00 - 22:30
Q4: 22:30 - 00:00
90 Min London Session :
Q1: 00:00 - 01:30
Q2: 01:30 - 03:00 (True Open at 01:30)
Q3: 03:00 - 04:30
Q4: 04:30 - 06:00
90 Min New York AM Session :
Q1: 06:00 - 07:30
Q2: 07:30 - 09:00 (True Open at 07:30)
Q3: 09:00 - 10:30
Q4: 10:30 - 12:00
90 Min New York PM Session :
Q1: 12:00 - 13:30
Q2: 13:30 - 15:00 (True Open at 13:30)
Q3: 15:00 - 16:30
Q4: 16:30 - 18:00
Micro Cycle (22.5-Minute Quarters) : Each 90-minute quarter is further divided into four 22.5-minute sub-segments (Micro Sessions).
True Opens in these sessions are defined as follows :
Asian Micro Session :
True Session Open : 19:30 - 19:52:30
London Micro Session :
T rue Session Open : 01:30 - 01:52:30
New York AM Micro Session :
True Session Open : 07:30 - 07:52:30
New York PM Micro Session :
True Session Open : 13:30 - 13:52:30
By accurately identifying these True Open points across various timeframes, traders can effectively forecast the market direction, analyze price movements in detail, and optimize their trading positions. Prices trading above or below these key levels serve as critical benchmarks for determining market direction and making informed trading decisions.
🔵 Setting
Show True Range : Enable or disable the display of the True Range on the chart, including the option to customize the color.
Extend True Range Line : Choose how to extend the True Range line on the chart, with the following options:
None: No line extension
Right: Extend the line to the right
Left: Extend the line to the left
Both: Extend the line in both directions (left and right)
Show Table : Determines whether the table—which summarizes the phases (Q1 to Q4)—is displayed.
Show More Info : Adds additional details to the table, such as the name of the phase (Accumulation, Manipulation, Distribution, or Continuation/Reversal) or further specifics about each cycle.
🔵 Conclusion
The Quarterly Theory ICT, by dividing time into four distinct quarters (Q1, Q2, Q3, and Q4) and emphasizing the concept of the True Open, provides a structured and repeatable framework for analyzing price action across multiple time frames.
The consistent repetition of phases—Accumulation, Manipulation (Judas Swing), Distribution, and Continuation/Reversal—allows traders to effectively identify recurring price patterns and critical market turning points. Utilizing the True Open as a benchmark, traders can more accurately determine potential directional bias, optimize trade entries and exits, and manage risk effectively.
By incorporating principles of ICT (Inner Circle Trader) and fractal time, this strategy enhances market forecasting accuracy across annual, monthly, weekly, daily, and shorter trading sessions. This systematic approach helps traders gain deeper insight into market structure and confidently execute informed trading decisions.

Quarterly Theory ICT 01 [TradingFinder] XAMD + Q1-Q4 Sessions🔵 Introduction
The Quarterly Theory ICT indicator is an advanced analytical system based on the concepts of ICT (Inner Circle Trader) and fractal time. It divides time into quarterly periods and accurately determines entry and exit points for trades by using the True Open as the starting point of each cycle. This system is applicable across various time frames including annual, monthly, weekly, daily, and even 90-minute sessions.
Time is divided into four quarters: in the first quarter (Q1), which is dedicated to the Accumulation phase, the market is in a consolidation state, laying the groundwork for a new trend; in the second quarter (Q2), allocated to the Manipulation phase (also known as Judas Swing), sudden price changes and false moves occur, marking the true starting point of a trend change; the third quarter (Q3) is dedicated to the Distribution phase, during which prices are broadly distributed and price volatility peaks; and the fourth quarter (Q4), corresponding to the Continuation/Reversal phase, either continues or reverses the previous trend.
By leveraging smart algorithms and technical analysis, this system identifies optimal price patterns and trading positions through the precise detection of stop-run and liquidity zones.
With the division of time into Q1 through Q4 and by incorporating key terms such as Quarterly Theory ICT, True Open, Accumulation, Manipulation (Judas Swing), Distribution, Continuation/Reversal, ICT, fractal time, smart algorithms, technical analysis, price patterns, trading positions, stop-run, and liquidity, this system enables traders to identify market trends and make informed trading decisions using real data and precise analysis.
♦ Important Note :
This indicator and the "Quarterly Theory ICT" concept have been developed based on material published in primary sources, notably the articles on Daye( traderdaye ) and Joshuuu . All copyright rights are reserved.
🔵 How to Use
The Quarterly Theory ICT strategy is built on dividing time into four distinct periods across various time frames such as annual, monthly, weekly, daily, and even 90-minute sessions. In this approach, time is segmented into four quarters, during which the phases of Accumulation, Manipulation (Judas Swing), Distribution, and Continuation/Reversal appear in a systematic and recurring manner.
The first segment (Q1) functions as the Accumulation phase, where the market consolidates and lays the foundation for future movement; the second segment (Q2) represents the Manipulation phase, during which prices experience sudden initial changes, and with the aid of the True Open concept, the real starting point of the market’s movement is determined; in the third segment (Q3), the Distribution phase takes place, where prices are widely dispersed and price volatility reaches its peak; and finally, the fourth segment (Q4) is recognized as the Continuation/Reversal phase, in which the previous trend either continues or reverses.
This strategy, by harnessing the concepts of fractal time and smart algorithms, enables precise analysis of price patterns across multiple time frames and, through the identification of key points such as stop-run and liquidity zones, assists traders in optimizing their trading positions. Utilizing real market data and dividing time into Q1 through Q4 allows for a comprehensive and multi-level technical analysis in which optimal entry and exit points are identified by comparing prices to the True Open.
Thus, by focusing on keywords like Quarterly Theory ICT, True Open, Accumulation, Manipulation, Distribution, Continuation/Reversal, ICT, fractal time, smart algorithms, technical analysis, price patterns, trading positions, stop-run, and liquidity, the Quarterly Theory ICT strategy acts as a coherent framework for predicting market trends and developing trading strategies.
🔵b]Settings
Cycle Display Mode: Determines whether the cycle is displayed on the chart or on the indicator panel.
Show Cycle: Enables or disables the display of the ranges corresponding to each quarter within the micro cycles (e.g., Q1/1, Q1/2, Q1/3, Q1/4, etc.).
Show Cycle Label: Toggles the display of textual labels for identifying the micro cycle phases (for example, Q1/1 or Q2/2).
Table Display Mode: Enables or disables the ability to display cycle information in a tabular format.
Show Table: Determines whether the table—which summarizes the phases (Q1 to Q4)—is displayed.
Show More Info: Adds additional details to the table, such as the name of the phase (Accumulation, Manipulation, Distribution, or Continuation/Reversal) or further specifics about each cycle.
🔵 Conclusion
Quarterly Theory ICT provides a fractal and recurring approach to analyzing price behavior by dividing time into four quarters (Q1, Q2, Q3, and Q4) and defining the True Open at the beginning of the second phase.
The Accumulation, Manipulation (Judas Swing), Distribution, and Continuation/Reversal phases repeat in each cycle, allowing traders to identify price patterns with greater precision across annual, monthly, weekly, daily, and even micro-level time frames.
Focusing on the True Open as the primary reference point enables faster recognition of potential trend changes and facilitates optimal management of trading positions. In summary, this strategy, based on ICT principles and fractal time concepts, offers a powerful framework for predicting future market movements, identifying optimal entry and exit points, and managing risk in various trading conditions.

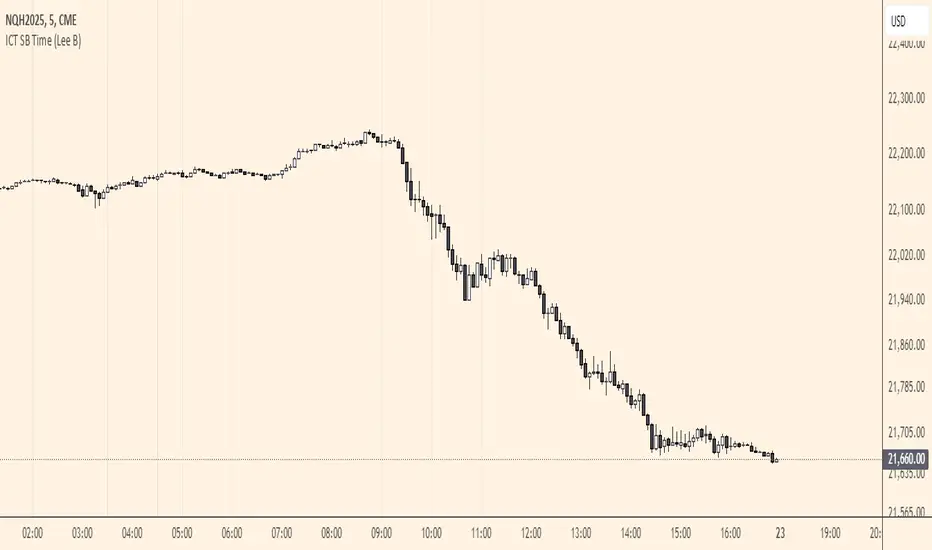
ICT SB Time (Lee B)A minimal and clean indicator that simply plots the ICT Silver Bullet time windows for you on the chart with vertical lines.
It also has the option to show other important times, like 00:00, 8:30, and 9:30. Toggles in settings let you change line color, turn any of them off temporarily, and can limit their visibility to only the lower timeframes for less clutter.
I hope you find this indicator useful... and happy trading!
Lee B