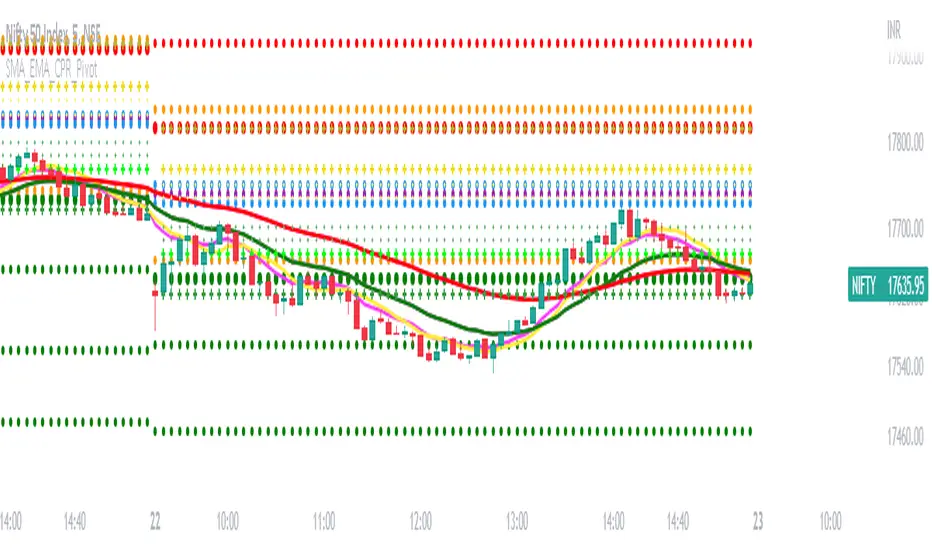
SMA_EMA_CPR_PivotThis Script can do multiple jobs in single indicator.
Like -:
Plot 3 SMA as per your inputs.
Plot 3 EMA as per your inputs.
Plot CPR Levels.
Plot Pivot Levels.
Plot Previous Day High Low.
Indicator can used in Intraday stock trading, Positional Trading and options trading.
Please Enjoy.
Strategy
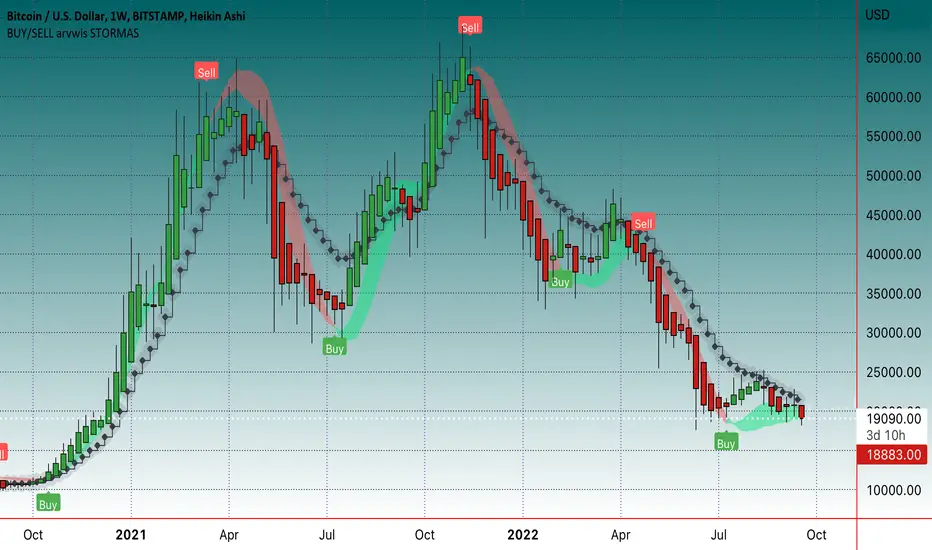
BUY/SELL arvwis STORMASBuy/sell indikatorius, geriausia naudoti ant didesnių timefreimų, bet tinka ir ant mažesnių
Coral Trend Pullback Strategy (TradeIQ)Description:
Strategy is taken from the TradeIQ YouTube video called "I Finally Found 80% Win Rate Trading Strategy For Crypto".
Check out the full video for further details/clarification on strategy entry/exit conditions.
The default settings are exactly as TradeIQ described in his video.
However I found some better results by some tweaking settings, increasing R:R ratio and by turning off confirmation indicators.
This would suggest that perhaps the current confirmation indicators are not the best options. I'm happy to try add some other optional confirmation indicators if they look to be more effective.
Recommended timeframe: 1H
Strategy incorporates the following features:
Risk management:
Configurable X% loss per stop loss
Configurable R:R ratio
Trade entry:
Based on strategy conditions below
Trade exit:
Based on strategy conditions below
Backtesting:
Configurable backtesting range by date
Trade drawings:
Each entry condition indicator can be turned on and off
TP/SL boxes drawn for all trades. Can be turned on and off
Trade exit information labels. Can be turned on and off
NOTE: Trade drawings will only be applicable when using overlay strategies
Alerting:
Alerts on LONG and SHORT trade entries
Debugging:
Includes section with useful debugging techniques
Strategy conditions
Trade entry:
LONG
C1: Coral Trend is bullish
C2: At least 1 candle where low is above Coral Trend since last cross above Coral Trend
C3: Pullback happens and price closes below Coral Trend
C4: Coral Trend colour remains bullish for duration of pullback
C5: After valid pullback, price then closes above Coral Trend
C6: Optional confirmation indicators (choose either C6.1 or C6.2 or NONE):
C6.1: ADX and DI (Single indicator)
C6.1.1: Green line is above red line
C6.1.2: Blue line > 20
C6.1.3: Blue trending up over last 1 candle
C6.2: Absolute Strengeh Histogram + HawkEye Volume Indicator (Two indicators combined)
C6.2.1: Absolute Strengeh Histogram colour is blue
C6.2.2: HawkEye Volume Indicator colour is green
SHORT
C1: Coral Trend is bearish
C2: At least 1 candle where high is below Coral Trend since last cross below Coral Trend
C3: Pullback happens and price closes above Coral Trend
C4: Coral Trend colour remains bearish for duration of pullback
C5: After valid pullback, price then closes below Coral Trend
C6: Optional confirmation indicators (choose either C6.1 or C6.2 or NONE):
C6.1: ADX and DI (Single indicator)
C6.1.1: Red line is above green line
C6.1.2: Blue line > 20
C6.1.3: Blue trending up over last 1 candle
C6.2: Absolute Strengeh Histogram + HawkEye Volume Indicator (Two indicators combined)
C6.2.1: Absolute Strengeh Histogram colour is red
C6.2.2: HawkEye Volume Indicator colour is red
NOTE: All the optional confirmation indicators cannot be overlayed with Coral Trend so feel free to add each separately to the chart for visual purposes
Trade exit:
Stop Loss: Calculated by recent swing low over previous X candles (configurable with "Local High/Low Lookback")
Take Profit: Calculated from R:R multiplier * Stop Loss size
Credits
Strategy origin: TradeIQ's YouTube video called "I Finally Found 80% Win Rate Trading Strategy For Crypto"
It combines the following indicators for trade entry conditions:
Coral Trend Indicator by @LazyBear (Main indicator)
Absolute Strength Histogram | jh by @jiehonglim (Optional confirmation indicator)
Indicator: HawkEye Volume Indicator by @LazyBear (Optional confirmation indicator)
ADX and DI by @BeikabuOyaji (Optional confirmation indicator)

Ultra Moving Average Rating Trend StrategyThis is a technical analysis strategy based initially on the rating strategy, but fully adapted and converted to moving average rating.
In this case we are using: Ichimoku, SMA, EMA, ALMA, SMMA, LSMA, VWMA, DEMA, HMA, KAMA FRAMA, VIDYA, JMA, TEMA, ZLEMA, TRIMA and T3 moving averages.
With all of them together I am making an index.
Rules for entry and exit:
If % percentage of all the moving averages is telling to go long , we go long or exit short. And viceversa for short.
If there are any questions, please let me know !

HHLL Strategy This is simple Highest high and Lowest low strategy.
Buy when break HH+offset
Sell when break LL+offset
Offset = (HH-LL)/2

SUPPORT RESISTANCE STRATEGY [5MIN TF]A SUPPORT RESISTANCE BREAKOUT STRATEGY for 5 minute Time-Frame , that has the time condition for Indian Markets
The Timing can be changed to fit other markets, scroll down to "TIME CONDITION" to know more.
The commission is also included in the strategy .
The basic idea is when ,
1) Price crosses above Resistance Level ,indicated by Red Line, is a Long condition.
2) Price crosses below Support Level ,indicated by Green Line , is a Short condition.
3) Candle high crosses above ema1, is a part of the Long condition .
4) Candle low crosses below ema1, is a part of the Short condition .
5) Volume Threshold is an added confirmation for long/short positions.
6) Maximum Risk per trade for the intraday trade can be changed .
7) Default qty size is set to 50 contracts , which can be changed under settings → properties → order size.
8) ATR is used for trailing after entry, as mentioned in the inputs below.
// ═════════════════════════//
// ————————> INPUTS <————————— //
// ═════════════════════════//
→ L_Bars ———————————> Length of Resistance / Support Levels.
→ R_Bars ———————————> Length of Resistance / Support Levels.
→ Volume Break ———————> Volume Breakout from range to confirm Long/Short position.
→ Price Cross Ema —————> Added condition as explained above (3) and (4).
→ ATR LONG —————————> ATR stoploss trail for Long positions.
→ ATR SHORT ————————> ATR stoploss trail for Short positions.
→ RISK ————————————> Maximum Risk per trade intraday.
The strategy was back-tested on TCS ,the input values and the results are mentioned under "BACKTEST RESULTS" below.
// ═════════════════════════ //
// ————————> PROPERTIES<——————— //
// ═════════════════════════ //
Default_qty_size ————> 50 contracts , which can be changed under
Settings
↓
Properties
↓
Order size
// ═══════════════════════════════//
// ————————> TIME CONDITION <————————— //
// ═══════════════════════════════//
The time can be changed in the script , Add it → click on ' { } ' → Pine editor→ making it a copy [right top corner} → Edit the line 27.
The Indian Markets open at 9:15am and closes at 3:30pm.
The 'time_cond' specifies the time at which Entries should happen .
"Close All" function closes all the trades at 3pm , at the open of the next candle.
To change the time to close all trades , Go to Pine Editor → Edit the line 92 .
All open trades get closed at 3pm , because some brokers don't allow you to place fresh intraday orders after 3pm .
// ═══════════════════════════════════════════════ //
// ————————> BACKTEST RESULTS ( 100 CLOSED TRADES )<————————— //
// ═══════════════════════════════════════════════ //
INPUTS can be changed for better Back-Test results.
The strategy applied to NSE:TCS ( 5 min Time-Frame and contract size 50) gives us 60% profitability , as shown below
It was tested for a period a 6 months with a Profit Factor of 1.8 ,net Profit of 30,000 Rs profit .
Sharpe Ratio : 0.49
Sortino Ratio : 1.4
The graph has a Linear Curve with Consistent Profits.
The INPUTS are as follows,
1) L_Bars —————————> 4
2) R_Bars —————————> 4
3) Volume Break ————> 5
4) Price Cross Ema ——> 100
5) ATR LONG ——————> 2.4
6) ATR SHORT —————> 2.6
7) RISK —————————> 2000
8) Default qty size ——> 50
NSE:TCS
Save it to favorites.
Apply it to your charts Now !!
Thank You ☺ NSE:TCS

PIVOT STRATEGY [INDIAN MARKET TIMING]
A Back-tested Profitable Strategy for Free!!
A PIVOT INTRADAY STRATEGY for 5 minute Time-Frame , that also explains the time condition for Indian Markets
The Timing can be changed to fit other markets, scroll down to "TIME CONDITION" to know more.
The commission is also included in the strategy .
The basic idea is when ,
1) Price crosses above ema1 ,indicated by pivot highest line in green color .
2) Price crosses below ema1 ,indicated by pivot lowest line in red color .
3) Candle high crosses above pivot highest , is the Long condition .
4) Candle low crosses below pivot lowest , is the Short condition .
5) Maximum Risk per trade for the intraday trade can be changed .
6) Default_qty_size is set to 60 contracts , which can be changed under settings → properties → order size .
7) ATR is used for trailing after entry, as mentioned in the inputs below.
// ═════════════════════════//
// ————————> INPUTS <————————— //
// ═════════════════════════//
Leftbars —————> Length of pivot highs and lows
Rightbars —————> Length of pivot highs and lows
Price Cross Ema —————> Added condition
ATR LONG —————> ATR stoploss trail for Long positions
ATR SHORT —————> ATR stoploss trail for Short positions
RISK —————> Maximum Risk per trade for the day
The strategy was back-tested on RELIANCE ,the input values and the results are mentioned under "BACKTEST RESULTS" below .
// ═════════════════════════ //
// ————————> PROPERTIES<——————— //
// ═════════════════════════ //
Default_qty_size ————> 60 contracts , which can be changed under settings
↓
properties
↓
order size
// ═══════════════════════════════//
// ————————> TIME CONDITION <————————— //
// ═══════════════════════════════//
The time can be changed in the script , Add it → click on ' { } ' → Pine editor→ making it a copy [right top corner} → Edit the line 25 .
The Indian Markets open at 9:15am and closes at 3:30pm .
The 'time_cond' specifies the time at which Entries should happen .
"Close All" function closes all the trades at 3pm, at the open of the next candle.
To change the time to close all trades , Go to Pine Editor → Edit the line 103 .
All open trades get closed at 3pm , because some brokers don't allow you to place fresh intraday orders after 3pm .
NSE:RELIANCE
// ═══════════════════════════════════════════════ //
// ————————> BACKTEST RESULTS ( 128 CLOSED TRADES )<————————— //
// ═══════════════════════════════════════════════ //
INPUTS can be changed for better back-test results.
The strategy applied to NIFTY ( 5 min Time-Frame and contract size 60 ) gives us 60% profitability y , as shown below
It was tested for a period a 6 months with a Profit Factor of 1.45 ,net Profit of 21,500Rs profit .
Sharpe Ratio : 0.311
Sortino Ratio : 0.727
The graph has a Linear Curve with consistent profits .
The INPUTS are as follows,
1) Leftbars ————————> 3
2) Rightbars ————————> 5
3) Price Cross Ema ——————> 150
4) ATR LONG ————————> 2.7
5) ATR SHORT ———————> 2.9
6) RISK —————————> 2500
7) Default qty size ——————> 60
NSE:RELIANCE
Save it to favorites.
Apply it to your charts Now !!
↓
FOLLOW US FOR MORE !
Thank me later ;)

SSL + Wave Trend StrategyStrategy incorporates the following features:
Risk management:
Configurable X% loss per stop loss
Configurable R:R ratio
Trade entry:
Based on strategy conditions below
Trade exit:
Based on strategy conditions below
Backtesting:
Configurable backtesting range by date
Trade drawings:
Each entry condition indicator can be turned on and off
TP/SL boxes drawn for all trades. Can be turned on and off
Trade exit information labels. Can be turned on and off
NOTE: Trade drawings will only be applicable when using overlay strategies
Alerting:
Alerts on LONG and SHORT trade entries
Debugging:
Includes section with useful debugging techniques
Strategy conditions
Trade entry:
LONG
C1: SSL Hybrid baseline is BLUE
C2: SSL Channel crosses up (green above red)
C3: Wave Trend crosses up (represented by pink candle body)
C4: Entry candle height is not greater than configured threshold
C5: Entry candle is inside Keltner Channel (wicks or body depending on configuration)
C6: Take Profit target does not touch EMA (represents resistance)
SHORT
C1: SSL Hybrid baseline is RED
C2: SSL Channel crosses down (red above green)
C3: Wave Trend crosses down (represented by orange candle body)
C4: Entry candle height is not greater than configured threshold
C5: Entry candle is inside Keltner Channel (wicks or body depending on configuration)
C6: Take Profit target does not touch EMA (represents support)
Trade exit:
Stop Loss: Size configurable with NNFX ATR multiplier
Take Profit: Calculated from Stop Loss using R:R ratio
Credits
Strategy is based on the YouTube video "This Unique Strategy Made 47% Profit in 2.5 Months " by TradeSmart.
It combines the following indicators to determine trade entry/exit conditions:
Wave Trend: Indicator: WaveTrend Oscillator by @LazyBear
SSL Channel: SSL channel by @ErwinBeckers
SSL Hybrid: SSL Hybrid by @Mihkel00
Keltner Channels: Keltner Channels Bands by @ceyhun
Candle Height: Candle Height in Percentage - Columns by @FreeReveller
NNFX ATR: NNFX ATR by @sueun123

Pro Trading Art Open Range Breakout StrategyThis strategy is based on Selected Candle High Low Breakout with buffer point.
You can select specific candle from input tab by giving time of that candle.
Default Settings:
Start Hour : Hour of starting candle means from this input you can specify opening candle. Default is 9.
Start Minute: Minute of starting candle. Default is 15. Means Default opening candle is 9:15
Stop Hour : Means After this time no new trade will execute.
End Hour & End Minute & Close All Trade : Means when you specify End Hour and Minute and Close all trade is true then strategy will close all trade on specified time.
Buffer : With the help of this option you can add some point in High and low of Opening Candle
Trade Mode : You can specify Target and Stop Loss in point or Percent
Stop Loss Point or Percent : This will work according to Trade Mode
Target Point Or Percent : This will work according to Trade Mode

Risk Management Strategy TemplateThis strategy is intended to be used as a base template for building new strategies.
It incorporates the following features:
Risk management:
Configurable X% loss per stop loss
Configurable R:R ratio
Trade entry:
Calculated position size based on risk tolerance
Trade exit:
Stop Loss currently configurable ATR multiplier but can be replaced based on strategy
Take Profit calculated from Stop Loss using R:R ratio
Backtesting:
Configurable backtesting range by date
Trade drawings:
TP/SL boxes drawn for all trades. Can be turned on and off
Trade exit information labels. Can be turned on and off
NOTE: Trade drawings will only be applicable when using overlay strategies
Debugging:
Includes section with useful debugging techniques
Strategy conditions
Trade entry:
LONG
C1: Price is above EMA line
C2: RSI is crossing out of oversold area
SHORT
C1: Price is below EMA line
C2: RSI is crossing out of overbought area
Trade exit:
Stop Loss: Stop Loss ATR multiplier is hit
Take Profit: R:R multiplier * Stop Loss is hit
The idea is to use RSI to catch pullbacks within the main trend.
Note that this strategy is intended to be a simple base strategy for building upon. It was not designed to be traded in its current form.

Accumulation Stage Identifier and Strategy around for TradingIn the psychology of trading at any market condition, there are four stage usually occurs on any tickers.
Stage 1 -> Neglect phase or consolidation phase
It occurs when the company does not produce the expected result and waiting for next result.
It can extend for days, weeks, months and years. Never give entry at this stage though that blue-chip told to be cheaper in price.
Stage 2 -> Accumulation
It occurs when the company's earning and sales consistently grows.
It can extend for days, weeks, months but should not expect the continues increase in price, as there will be potential pull-back which can be considered as opportunity to accumulate.
If the company fundamental is good, just give some space at the time of pullback.
Most of the time, the pullback volume will be low to compare to volume at the time of increase.
Usually, the stock that is going through accumulation stage will definitely trade above 200SMA and short term MA will be greater than long term moving average.
Continues the highest high and highest low along with volume.
Stage 3 -> Distribution
It occurs when the company's earning and sales stagnated due to certain reason.
It can extend for days, weeks while the price and volume highly volatile.
High volume while the price low
Typically, the stock that is going through distribution stage will certainly trade below 200SMA and short term MA will be lesser than long term moving average.
Continues the lowest high and lowest low along with volume.
Stage 4 -> Capitalization
Price reaches the 52W low while volume spikes on big down.
In each stage, the price & volume are perfect indicator to highlight the situation and the trader with proper discipline and patients can certainly reap the fruitful outcome of accumulation stage.
Based on this explanation, here is the strategy that is created with 50,90 & 200 Simple moving average and price volume trends (PVT) indicator applied on MACD to signal whenever the PVT convergence and divergence.
Note:
As the indicator designed to signal on the ticker that trade above 200 moving average, it is good to use this strategy on companies that are fundamental strong.
Whenever, there is pull back happens, the strategy might signal for exit, however, here comes the traders patient based on the conviction on the particular chosen stocks.
White being patient is good, disciplinary in following the strategy also important. Hence, consider the action when the stock goes opposite direction from your expectation.
Hope this strategy would help you find the profit.
Happy investing.

VWAP Push StrategyThis strategy is unfortunately not finished yet.
A pretty simple strategy. If price broke through VWAP and had three consecutive candles following the breakthroughs trend, the high of the third candle will be drawn. If this happened after a crossover of the vwap and price breaks through the high of the third candle, strategy will go long. Short will be the same after crossing under the vwap. A long or short will be closed after crossing the vwap in the opposite direction, so the vwap is kind of a trailing stop.
Unfortunately, I could not manage to stop the script from entering multiple times into one drawn high or low. Of course, if a high was crossed the script should wait for a new formed high before entering a new long. If someone would find a solution to this, it would be great, because I think it is a nice strategy .
Should work great scalping 5min charts (when scripting, I used the SPX for reference).

Price change scalping short and long strategy indicatorPrice change scalping Short and Long indicator uses a rate of change momentum oscillator to calculate the percent change in price between a period of time. Rate of change calculation takes the current price and compares it to a price of "n" periods while the period of time can be defined by a user. The calculated rate of change value is then compared to the upper threshold and the lower threshold values to determine if a position should be opened. If the threshold is crossed and filtering conditions are met a strategy position will be triggered. Entry, take profit, and stop loss prices are calculated and displayed on the chart as well as positions directions. Once the entry price is crossed, a long or short position is created and once the take profit price is crossed, the stop loss price will begin to trail behind the price action using the close of the previous bar. Once the trailing stop price is crossed, the position is closed. If the entry price is not crossed and the price action crosses the stop level, the trade setup is cancelled. The indicator is enhanced by DCA algorithm which allows to average entry price with safety orders. The script also allows to use Martingale coefficient to increase averaging power
Advantages of this script:
The indicator has custom alert settings for each strategy action
The indicator can be used with 3Commas, Cryptohopper, Alertatron or Zignaly bots
High frequency and low duration of trades
Can be used with short-term timeframes ranging from 5 to 60 minutes
Indicator is sustainable to market slumps due to DCA implementation
Can be used for short and long positions (can be adjusted to long only, short only or both)
Can be applied to any market and quote currency
Easy to configure user interface settings
Built in detailed statistic menu
How to use?
1. Apply the indicator to a trading pair your are interested in using 5 to 60 minutes timeframe chart
2. Configure the indicator: change layer values, order size multiple and take profit/stop loss values according to current market cycle stage
3. Set up a TradingView custom alert using the indicator settings to trigger on a condition you are interested in
4. indicator will send alerts when to enter and when to exit positions which can be applied to your portfolio using external trading platforms
5. Update settings once market conditions are changed using backtests on a monthly period
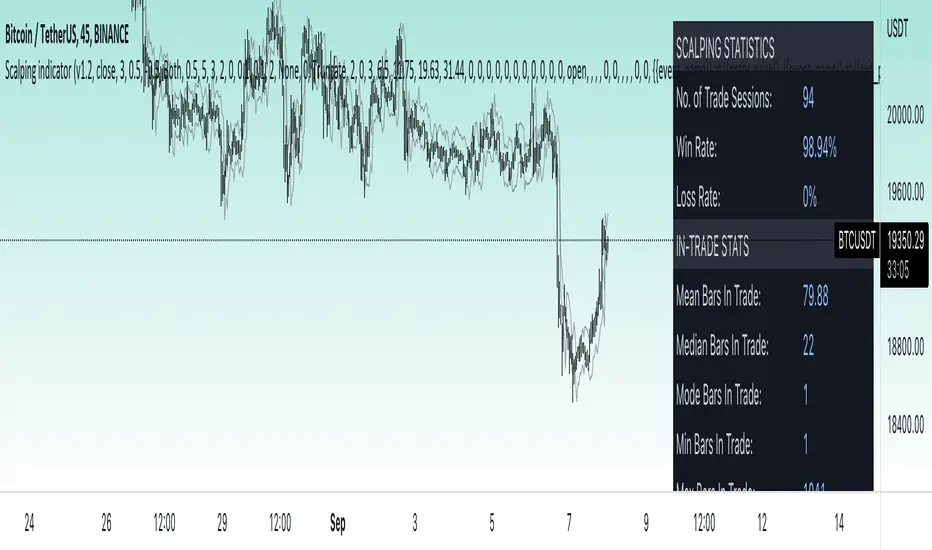
Price change scalping short and long strategyPrice change scalping Short and Long strategy uses a rate of change momentum oscillator to calculate the percent change in price between a period of time. Rate of change calculation takes the current price and compares it to a price of "n" periods while the period of time can be defined by a user. The calculated rate of change value is then compared to the upper threshold and the lower threshold values to determine if a position should be opened. If the threshold is crossed and filtering conditions are met a strategy position will be triggered. Entry, take profit, and stop loss prices are calculated and displayed on the chart as well as positions directions. Once the entry price is crossed, a long or short position is created and once the take profit price is crossed, the stop loss price will begin to trail behind the price action using the close of the previous bar. Once the trailing stop price is crossed, the position is closed. If the entry price is not crossed and the price action crosses the stop level, the trade setup is cancelled. The strategy is enhanced by DCA algorithm which allows to average entry price with safety orders. The script also allows to use Martingale coefficient to increase averaging power
Advantages of this script:
Strategy has high net profit of 293% at backtests
Backtests show high accuracy around 71%
High frequency and low duration of trades
Can be used with short-term timeframes ranging from 5 to 60 minutes
Strategy is sustainable to market slumps due to DCA implementation
Can be used for short and long positions (can be adjusted to long only, short only or both)
Can be applied to any market and quote currency
Easy to configure user interface settings
Built in detailed statistic menu
How to use?
1. Apply the strategy to a trading pair your are interested in using 5 to 60 minutes timeframe chart
2. Configure the strategy: change layer values, order size multiple and take profit/stop loss values according to current market cycle stage
3. Set up a TradingView alert to trigger when strategy conditions are met
4. Strategy will send alerts when to enter and when to exit positions which can be applied to your portfolio using external trading platforms
5. Update settings once market conditions are changed using backtests on a monthly period

TTP Kent Strat PROKent Strat PRO trades breakouts using Bollinger Bands together with SuperTrend.
PRO features:
- 3commas bot alerts for long/short bots
- Custom JSON bots alerts
Features:
- Risk/reward ratio parameter
- Longs, shorts and combined positions.
- Breakout settings
- Trailing SL, trailing TP
- Use of latest candles to place the SL using a lookback parameter (how many candles to look back for a low/high price)
- Select your SL between the ATR trendline and the latest candle: the closest or furthest away value
- Show the trendline
- Backtest mode for accurate backtests
- Signal mode for live price accurate signals
- Date range backtesting
Filters:
- EMA 200 filter and timeframe selector. This filter can be used to trade with the trend: open longs on an uptrend and shorts on a downtrend.
- ADX filter using threshold. This filter can be used to filter entries where the trend is not very strong.
- ADX pointing up. ADX values pointing up and above certain threshold can improve entries.
- Relative volume filter based on the volume being X% above the MA of the Volume. Trading with volume can help filtering out bad trades.
Example setup:
1) pick BINANCE:ETHUSDT chart, 15 min chart
2) trade longs + shorts
3) pick ratio 3
4) trailing SL checked
5) trailing TP unchecked
7) stop loss "furthest"
8) candle loopback 30
9) BB period 21, dev 1, ATR filter on, atr period 5
10) EMA filter on, 15 min
11) ADX off
12) Volume filter on set to 60%

TTP Kent StratKent Strat trades breakouts using Bollinger Bands together with SuperTrend.
Features:
- Risk/reward ratio parameter
- Longs, shorts and combined positions.
- Breakout settings
- Trailing SL, trailing TP
- Use of latest candles to place the SL using a lookback parameter (how many candles to look back for a low/high price)
- Select your SL between the ATR trendline and the latest candle: the closest or furthest away value
- Show the trendline
- Backtest mode for accurate backtests
- Signal mode for live price accurate signals
- Date range backtesting
Filters:
- EMA 200 filter and timeframe selector. This filter can be used to trade with the trend: open longs on an uptrend and shorts on a downtrend.
- ADX filter using threshold. This filter can be used to filter entries where the trend is not very strong.
- ADX pointing up. ADX values pointing up and above certain threshold can improve entries.
- Relative volume filter based on the volume being X% above the MA of the Volume. Trading with volume can help filtering out bad trades.
Example setup:
1) pick BINANCE:ETHUSDT chart, 15 min chart
2) trade longs + shorts
3) pick ratio 3
4) trailing SL checked
5) trailing TP unchecked
7) stop loss "furthest"
8) candle loopback 30
9) BB period 21, dev 1, ATR filter on, atr period 5
10) EMA filter on, 15 min
11) ADX off
12) Volume filter on set to 60%

3Commas Dollar cost averaging trading system (DCA)As investors, we often face the dilemma of willing high stock prices when we sell, but not when we buy. There are times when this dilemma causes investors to wait for a dip in prices, thereby potentially missing out on a continual rise. This is how investors get lured away from the markets and become tangled in the slippery slope of market timing, which is not advisable to a long-term investment strategy.
Skyrex developed a complex trading system based on dollar-cost averaging in Quick Fingers Luc's interpretation. It is a combinations of strategies which allows to systematically accumulate assets by investing scaled amounts of money at defined market cycle global support levels. Dollar-cost averaging can reduce the overall impact of price volatility and lower the average cost per asset thus even during market slumps only a small bounce is required to reach take profit.
The strategy script monitors a chart price action and identifies bases as they form. When bases are reached the script provides entry actions. During price action development an asset value can go lower and in this way the script will perform safety entries at each subsequent accumulation levels. When weighted average entry price reaches target profit the script will perform a take profit action.
Bases are identified as pivot lows in a fractal pattern and validated by an adjustable decrease/rise percentage to ensure significancy of identified bases. To qualify a pivot low, the indicator will perform the following validation:
Validate the price rate of change on drops and bounces is above a given threshold amount.
Validate the volume at the low pivot point is above the volume moving average (using a given length).
Validate the volume amount is a given factor of magnitude above is above the volume moving average.
Validate the potential new base is not too close to the previous range by using a given price percent difference threshold amount.
A fractal pattern is a recurring pattern on a price chart that can predict reversals among larger, more chaotic price movements.
These basic fractals are composed of five or more bars. The rules for identifying fractals are as follows:
A bearish turning point occurs when there is a pattern with the highest high in the middle and two lower highs on each side.
A bullish turning point occurs when there is a pattern with the lowest low in the middle and two higher lows on each side.
Basic dollar-cost averaging approach is enhances by implementation of adjustable accumulation levels in order to provide opportunity of setting them at defined global support levels and Martingale volume coefficient to increase averaging effect. According to Quick Fingers Luc's principles trading principles we added volume validation of a base because it allows to confirm that the market is resistant to further price decrease.
The strategy supports traditional and cryptocurrency spot, futures , options and marginal trading exchanges. It works accurately with BTC, USD, USDT, ETH and BNB quote currencies. Best to use with 1H timeframe charts and limit orders. The strategy can be and should be configured for each particular asset according to its global support and resistance levels and price action cycles. You can modify levels and risk management settings to receive better performance
The difference between core script and this interpretation is that this strategy is specially designed for 3Commas bots
How to use?
1. Apply strategy to a trading pair your are interested in using 1H timeframe chart
2. Configure the strategy: change layer values, order size multiple and take profit/stop loss values according to current market cycle stage
3. Set up a TradingView alert to trigger when strategy conditions are met
4. Strategy will send alerts when to enter and when to exit positions which can be applied to your portfolio using external trading platforms
5. Update settings once market conditions are changed using backtests on a monthly period

Consolidation Breakout [Indian Market Timing]OK let's get started ,
A Day Trading (Intraday) Consolidation Breakout Indication Strategy that explains time condition for Indian Markets .
The commission is also included in the strategy .
The basic idea is ,
1) Price crosses above upper band , indicated by a color change (green) is the Long condition .
2) Price crosses below lower band , indicated by a color change (red) is the Short condition .
3) ATR is used for trailing after entry
// ═══════════════════════════════//
// ————————> TIME CONDITION <————————— //
// ═══════════════════════════════//
The Indian Markets open at 9:15am and closes at 3:30pm.
The time_condition specifies the time at which Entries should happen .
"Close All" function closes all the trades at 2:57pm.
All open trades get closed at 2:57pm , because some brokers dont allow you to place fresh intraday orders after 3pm.
NSE:NIFTY1!
// ═══════════════════════════════════════════════ //
// ————————> BACKTEST RESULTS ( 114 CLOSED TRADES )<————————— //
// ═══════════════════════════════════════════════ //
LENGTH , MULT (factor) and ATR can be changed for better backtest results.
The strategy applied to NIFTY (3 min Time-Frame and contract size 5) gives us 60% profitability , as shown below
It was tested for a period a 8 months with a Profit Factor of 2.2 , avg Trade of 6000Rs profit and Sharpe Ratio : 0.67
The graph has a Linear Curve with consistent profits.
NSE:NIFTY1!
Save it favorites.
Apply it to your charts Now !!
Thank me later ;)

X48 - Strategy | MA Type Cross + TPSL | Future&Spot | V.2Thank You For Open Source Code, This Strategy Ref. By 1.Simple Strategy Like MA Crossover For Long/Short or Spot Trade, 2. CDC Action Zone V.2 for BarPaint
This Strategy Mixing With MA Crossover Strategy and BarPaint By CDC Action Zone and TP/SL by Varbara
### How To Use Strategy : Setting EMA/SMA Crossover EMA/SMA, Any Value If You Want
For Long Position : Cross Up
For Short Position : Cross Down
Can Use With Spot Trade : Cross Up = Buy, Cross Down = Sell
TP/SL When Your OrderSize Change From any % Of Your TP/SL Value
### In Strategy Setting
Intitial Capital = Ex. 200
Order Size = Should Be Money Management Not Use 100% of Capital Ex. 10% of Capital (200$) = Order Size 20$
StopLoss and Take Profit = If You Run Trend TF 4H+ or 1D+ You Can Change TP% = 1,000% for nonlimit and Stop Loss 5 - 20% from your order size
Ex. Stoploss 15% = OrderSize / 100 x %SL = 20$/100 x 15% = 3$ Loss from order size 20$ (if you not set stop loss.)
Base Currency = (Your Currency) # Ex. USD
Commission = (Your Trading Fee) # Ex. Future Fee Can Check At Binance Fee Rate > www.binance.com > Choose Your Fee Type, Ex. USD M Future (Regular User) = 0.02 (Maker), 0.04 (Taker)
Commission Symbol Type = % # (Ref. By Binance Fee Rate)
### Notice ####
Default Setting It's Realistic From Normal Life Ex. Capital 200$ / Ordersize 20$ (10%)/ Commission 0.1% (Buy+Sell) / Slippage = 2 / TP = 1000% (nonlimit) / SL = 15%/OrderSize
Low Risk But High Return, Good Luck
### Bot Auto Trade by X4815162342 ###
if you wanna try my bot auto trade X48-3in1-bot : Contact My Line ID : x4815x
Full Command Alert For This Strategy If You Wanna See It's
'{"ex":"'+markettype+'","side": "'+longcommand+'", "amount": "@{{strategy.order.contracts}}", "symbol": "{{ticker}}", "passphrase": "'+passphrase+'","leverage":"'+str.tostring(leveragex)+'"}'
'{"ex":"'+markettype+'","side": "'+shortcommand+'", "amount": "@{{strategy.order.contracts}}", "symbol": "{{ticker}}", "passphrase": "'+passphrase+'","leverage":"'+str.tostring(leveragex)+'"}'
But Easy Than Full Command Just Use Thisssssss !! Strategy Be Manage Auto Long and Short or TPSL Position
You Don't Do Anything Just Use This Message to Alerts Message
{{strategy.order.alert_message}}
### If you don't use bot but just looking for strategy test ####
Just Pass Bot Setting Function It's Nothing Effect For Strategy !!!!!!
Let's Enjoy With Your Strategy BackTest 😁
Remember Beware Max drawdown%. I'm Recommend Lower Than 10% It's Very Good.

MACD ULTRA with ALERTS - by OVARIDE WORK IN PROGRESS!
Coded by OVARIDE (littlegreenfish)
Made to be used with Dark Theme. Made to be used with Heikin Ashi bars (You can enable Real Price from chart settings). Test and use at your own risk. Not recommended for NEW/ INEXPERIENCED TRADERS using this for short-timeframe scalping. Bot integration is possible for high timeframes using the built-in alerts as a trigger via webhooks
Features
This is a reworked MACD code with added buffs for traders wanting more information from this basic indicator.
What this indicator does -
1. Plots a traditional MACD indicator with full input control from within the settings. All colors and values are editable , as you would expect from the standalone indicator.
2. Adds shape to the chart when MACD crosses over Signal line, while both MACD and Signal lines are below the ZERO line.
3. Adds shape to the chart when MACD crosses over ZERO line.
4. Highlights trend direction. Purple = Up Trend Likely , Yellow = Up Trend may end (use caution) , Red = Strong Down Trend Begins.
5. Ability to set alerts for -
a) When MACD crosses Signal Line.
b) When MACD crosses Zero line.
c) When an Up Trend is likely to begin.
d) When an Up Trend is slowing and may end.
e) When a Strong Down Trend begins.
Considerations -
1. Traders may use this indicator in conjunction with an existing strategy to confirm entries and exits. Traders may also use this indicator as a standalone indicator to assist with entries and exits.
2. Possible Long entries -
a) When MACD crosses Signal line while blow the Zero Line
b) When MACD crosses Zero
c) When Up Trend is Likely to begin and the background is highlighted in purple.
3. Possible stop-loss / exits (Omitted MACD crossing below Signal line and MACD crossing below Zero line)
a) When Up Trend Is slowing and the background is highlighted Yellow
b) When a Strong Down trend begins and the background is highlighted in Red. All open long position trades should be ended here.
4. The trend algorithm is hard-coded. Changing the MACD and Signal values from within the settings WILL NOT change the result of when and how the trend directions are highlighted.
5. Trend highlights are ONLY A GUIDE . You can still take entry positions in non-highlighted, yellow or red regions if your overall technical analysis tells you to.
UPDATE NOTES (IF ANY) WILL BE PUBLISHED BELOW

Monthly Returns of a Strategy in a ChartIt's a simple example of how you can present your strategy's monthly performance in a chart.
You maybe know that there is no support of these kind of charts in TradingView so this chart is actually a table object under the hood.
Table visual appearance is customizable, you can change:
Location
Bar Width / High
Colors
Thanks to @MUQWISHI for hard work, for helping me coding it.
It's not about the strategy itself but the way you display returns on your chart. So pls don't critique my choice of the strategy and its performance 🙂
Disclaimer
Please remember that past performance may not be indicative of future results.
Due to various factors, including changing market conditions, the strategy may no longer perform as well as in historical backtesting.
This post and the script don’t provide any financial advice.

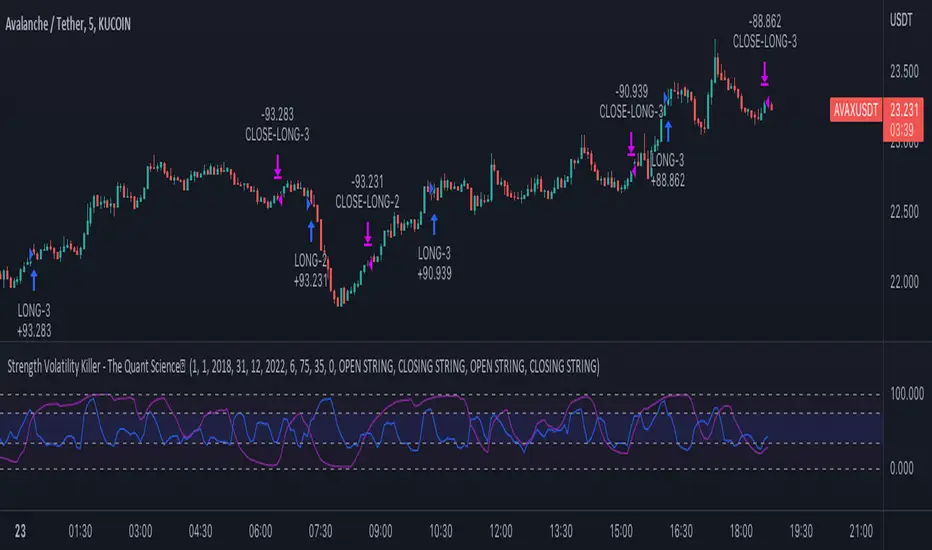
Strength Volatility Killer - The Quant ScienceStrength Volatility Killer - The Quant Science™ is based on a special version of RSI (Relative Strength Index), created with the simple average and standard deviation.
DESCRIPTION
The algorithm analyses the market and opens positions following three different volatility entry conditions. Each entry has a specific and personal exit condition. The user can setting trailing stop loss from user interface.
USER INTERFACE SETTING
Configures the algorithm from the user interface.
AUTO TRADING COMPLIANT
With the user interface, the trader can easily set up this algorithm for automatic trading.
BACKTESTING INCLUDED
The trader can adjust the backtesting period of the strategy before putting it live. Analyze large periods such as years or months or focus on short-term periods.
NO LIMIT TIMEFRAME
This algorithm can be used on all timeframes.
GENERAL FEATURES
Multi-strategy: the algorithm can apply long strategy or short strategy.
Built-in alerts: the algorithm contains alerts that can be customized from the user interface.
Integrated indicator: indicator is included.
Backtesting included: quickly automatic backtesting of the strategy.
Auto-trading compliant: functions for auto trading are included.
ABOUT BACKTESTING
Backtesting refers to the period 13 June 2022 - today, ticker: AVAX/USDT, timeframe 5 minutes.
Initial capital: $1000.00
Commission per trade: 0.03%
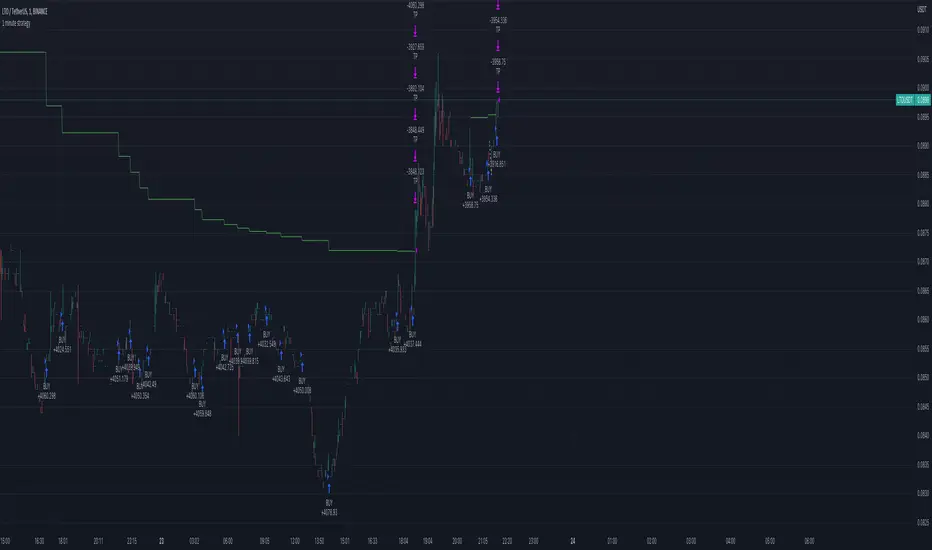
1 minute crypto strategy (MTF ZigZag)Please read the following explanation and notes before using this strategy.
This strategy is based on pyramiding. It uses two trend indicators(zigzag) in two different timeframes. One can be used to identify trend in higher timeframe and the other can be used to identify trend in smaller time frame. You can change them according to your preference. The default timeframes are set the same so the strategy only opens the trades according to one timeframe (20min). You can change the timeframe of the trend indicators to any timeframe in the settings but first you should add that timeframe to your chart timeframe so you can see that timeframe in the settings.
The first timeframe is for lower timeframe trend identification and the second timeframe is for higher timeframe identification in the settings.
IMPORTANT NOTES:
1. This strategy works best with low cap high volatile Cryptos. It is riskier on big cap cryptos in long term since it takes longer for them to recover from a big drop.
2. This strategy works in any timeframe. The lower the TF the higher profit.
3. This strategy is LONG only (spot).
4. It is very important to run a deep backtest (for example 1 year) and change the settings accordingly on the cryptos you want to trade to see how it performs in longterm.
5. The default pyramiding value is 30 and 3.33% of the portfolio (100/30=3.33%) is used for each trade. It means the strategy opens maximum 30 trades before the TP is hit. If you change the pyramiding you should also change order size as well in order for the strategy to show the exact calculation (your portfolio amount percentage/pyramiding value=ordersize percentage). If you increase pyramiding value the strategy performs safer in long term.
6. The default TP is 1% and the default SL is 80%. You can change the settings according to the backtest on the coins you want to trade. But it is better not to increase the TP.
7. The indicators don't repaint.
8. Please make sure to backtest and fully understand the way this strategy works before using it.