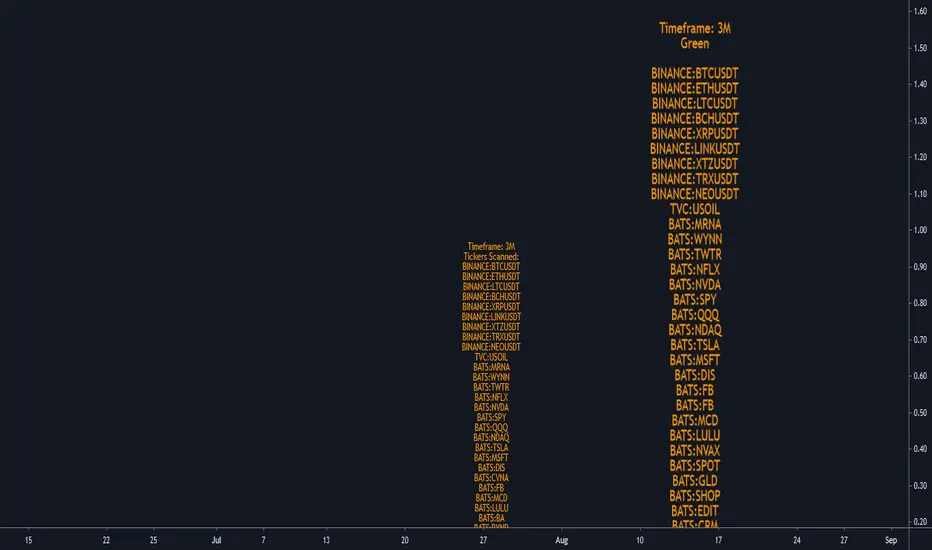
Screener Green?Based on the teachings of Rob Smith
Ability to change the timeframe and the symbols this indicator is scanning through in the input tab under settings of this indicator. Maximum symbols 40. All of the symbols need to entered. If any symbol field is left empty, the script might not work properly.
This is a simple screener which checks if the current candle is green/going up.
I add it 4 times and change the timeframes on each one to tell me if any of the symbols scanning through have FTFC(Full time frame continuity). If a symbol appears in all of the timeframes selected, it would have continuity in all those timeframe. Meaning going up in all of those timeframes.
I like to add a textbox manually on top of the labels when I change the timeframe to tell me which timeframe the indicator is scanning through.
Always double check in the settings of the indicator that the correct timeframe is selected.
First label is for all of the symbols the indicator is scanning.
Second label is the result of the scan. Text is bigger in this label than the first label to differentiate from the first label and for ease of use.
Please DM me on how to access this indicator.
Strat
Screener Potential 312 / 212 / 122Based on the teachings of Rob Smith
1= Inside Candle
2= Goes past the previous candle's price up or down
3= Goes past the previous candle's price on both sides
Ability to change the timeframe and the symbols this indicator is scanning through in the input tab under settings of this indicator. Maximum symbols 40.
Looking for short or long setups within 40 symbols. By default some symbols are entered in the indicator already. They cannot be left empty. If left empty, an error comes up and the script doesn't load.
The reversal setups this indicator is looking for
212
312
122
Can look through many timeframes like monthly, weekly, daily, intraday by changing the timeframe in the input tab under settings.
Default timeframe is set to 1 Day.
First label is for all of the symbols the indicator is scanning.
Second label is the result of the scan. Text is bigger than in this label than the first label to differentiate from the first label and for ease of use.
Please DM me on how to access this indicator.

Screener Inside BarsBased on the teachings of Rob Smith
1= Inside Candle
2= Goes past the previous candle's price up or down
3= Goes past the previous candle's price on both sides
Ability to change the timeframe and the symbols this indicator is scanning through in the input tab under settings of this indicator. Maximum symbols 40.
Looking for inside bars within 40 symbols. By default some symbols are entered in the indicator already. They cannot be left empty. If left empty, an error comes up and the script doesn't load.
By changing the timeframe, inside bars can be looked under many timeframes like Monthly, Weekly, Dialy, Intraday, etc.
First label is for all of the symbols the indicator is scanning.
Second label is the result of the scan. Text is bigger than in this label than the first label to differentiate from the first label and for ease of use.
Please DM me on how to access this indicator.

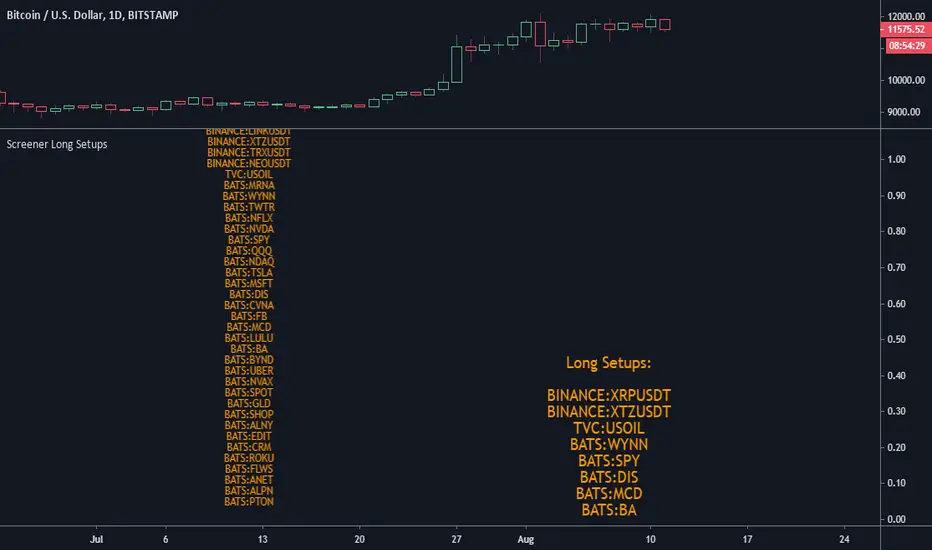
Screener Long SetupsBased on the teachings of Rob Smith
1= Inside Candle
2= Goes past the previous candle's price up or down
3= Goes past the previous candle's price on both sides
Ability to change the timeframe and the symbols this indicator is scanning through in the input tab under settings of this indicator. Maximum symbols 40.
Looking for long setups within 40 symbols. By default some symbols are entered in the indicator already. They cannot be left empty. If left empty, an error comes up and the script doesn't load.
Some of the reversal short setups this indicator is looking for
e.g.
212 = 2down 1inside 2up
22 = 2down 2up
33.. 3down 3up
etc
It is also looking for continuous setups as well
e.g.
22 = 2down 2down
212 = 2down 1inside 2down
etc
First label is for all of the symbols the indicator is scanning.
Second label is the result of the scan. Text is bigger than in this label than the first label to differentiate from the first label and for ease of use.
Please DM me on how to access this indicator.
Screener: Shorts SetupsBased on the teachings of Rob Smith
1= Inside Candle
2= Goes past the previous candle's price up or down
3= Goes past the previous candle's price on both sides
Ability to change the timeframe and the symbols this indicator is scanning through in the input tab under settings of this indicator. Maximum symbols 40.
Looking for short setups within 40 symbols. By default some symbols are entered in the indicator already. They cannot be left empty. If left empty, an error comes up and the script doesn't load.
Some of the reversal short setups this indicator is looking for
e.g.
212 = 2up 1inside 2down
22 = 2up 2down
33 = 3up 3down
etc
It's also looking for the continuous short setups as well
e.g.
212 = 2down 1inside 2down
22 = 2down 2down
etc
First label is for all of the symbols the indicator is scanning.
Second label is the result of the scan. Text is bigger than in this label than the first label to differentiate from the first label and for ease of use.
Please DM me on how to access this indicator.

TheStratHelper-Short Reversalsbased on the teachings of Rob Smith
1= Inside Candle
2= Break on one side
3= Englufing Candle/Outside Candle
Identifies short setups like 212, 312, 122 and 22
My potential entry is marked with a green line and a label that tells you the price as well. I typically enter 1 or 2 cents belowthe marked entry.
My potential target (magnitude) is marked with yellow lines and a label that tells you the price as well.
212, 312 and 122 has entry and magnitudes marked. If there are multiple magnitudes, those are marked with yellow lines which has the price written right above them. The program looks at potentially 4 or 5 magnitudes.
No magnitudes marked for a reversal 22.
Most of the colors can be customized
PM me for more info on how to access this indicator

TheStratHelper-Long Reversalsbased on the teachings of Rob Smith
1= Inside Candle
2= Break on one side
3= Englufing Candle/Outside Candle
Identifies long setups like 212, 312, 122 and 22
My potential entry is marked with a green line and a label that tells you the price as well. I typically enter 1 or 2 cents above the marked entry.
My potential target (magnitude) is marked with yellow lines and a label that tells you the price as well.
212, 312 and 122 has entry and magnitudes marked. If there are multiple magnitudes, those are marked with yellow lines which has the price written right above them. The program looks at potentially 4 or 5 magnitudes.
No magnitudes marked for a reversal 22.
Most of the colors can be customized
PM me for more info on how to access this indicator

TheStratHelperbased on the teachings of Rob Smith
1= Inside Candle
2= Break on one side
3= Englufing Candle/Outside Candle
Identifies setups like 22, 212, 312, etc
RL=Reverse Long
CL=Continuous Long
RS= Reversal Short
CS=Continuous Short
It can highlight a potential 312 or 122 combination
FTFC=Full time frame continuity
1d is calculated by looking at Monthly, Weekly and Daily timeframe
Intraday is calculated by looking at Monthly, Weekly, Daily and Hourly
A bunch of alerts are available with different combinations including any long or short trade.
Continuous 22 only has the triangles. Nothing written
Most of the colors can be customized
Broadening formations are experimental and only plot using the outside candles
PM me for more info on how to access this indicator

TheStratHelperBased on Rob Smith's Quant Edge
CL = Continuation Long e.g. 2up 1inside 2up
RL = Reversal Long (Rev Strat) e.g. 2down 1inside 2up
CS = Continuation Short
RL = Reverse Long (Rev Strat)
Most of the signals have the combinations like 2-1-2,3-1-2,etc written beside CL/RL/CS/RL except for the continuation 2-2 long and short signals. Those i have them set as a purple triangle up or down without a text.
Signals do not wait for the candle close. They show up as soon as the current/signal candle goes over or under the previous candle.
You can set signals for any long, any short or only the reversals or inside out signals.
I have tried to make this as custom as possible. You can set custom colors and choose which signals to display or hide.
Disclaimer: This is not the full system. Use this indicator at your own risk. I advise you to learn TheStrat from Rob Smith. I may be missing some combinations or have something wrong. I encourage you to let me know if there is something missing or something I can improve upon. I am neither an expert in Pine Script or TheStrat but I'll do my best to accommodate any requests.

Price Continuation (The Strat)Shows the historic bar type, whether it is up, down, up and inside, down and inside, up and outside, or down and outside. Will only display historic bar type based on the selected time timeframe. (Ex. if you are looking at the weekly time frame, you will only see the bar type for Year, Quarter, Month, and Week. It will not display the Day or Hour bar type.)

Candle Type w/2Up + 2DnCandle Type is based on @robintheblack's "THE STRAT" philosophy and @crinklebine's "candle type" pine script.
This version distinguishes 4 potential candle types:
I = Inside previous bar's range
O = Outside previous bar's range
U = Up (high is greater than previous bar's range & NOT outside)
D = Down (low is lower than previous bar's range & NOT ouside)

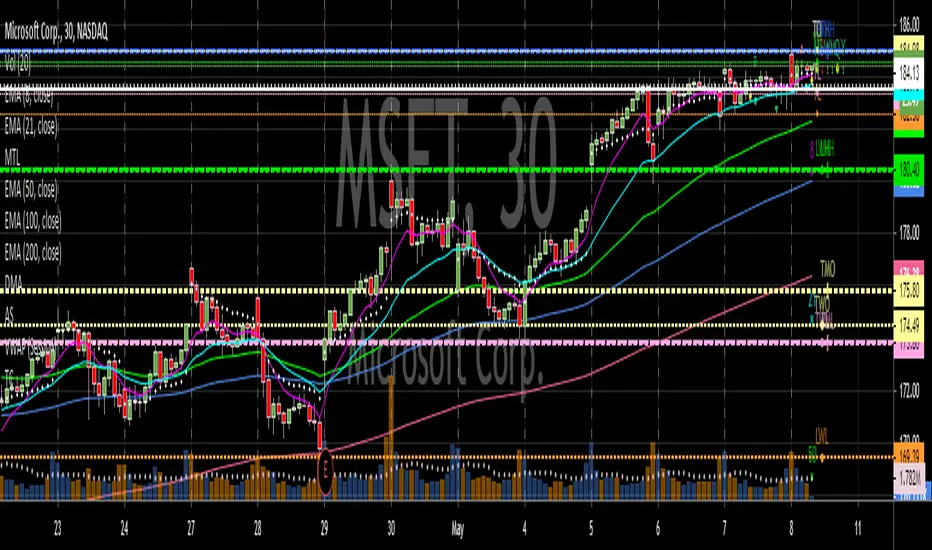
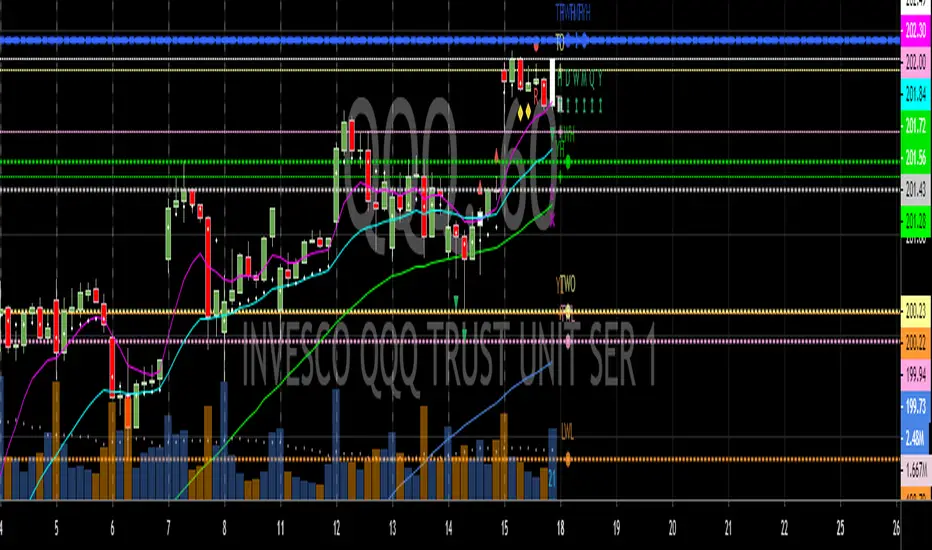
Multiple Timeframe LevelsBased on Rob Smith from T3Live's "The Strat" system.
Draws lines and labels for high/low of prior day, current day, prior week, current week, prior month, current month, prior year and current year.
Draws lines and labels for current day, week, month and year open.
Not recommended for those who have not completed Rob's course.
Timeframe ContinuityBased on Rob Smith from T3Live's "The Strat" system.
Places an indicator on the top right of the chart that shows if the current bar on the current or higher timeframe is red or green.
Allows the user to identify timeframe continuity or conflicting timeframes at a glance.
Not recommended for those who have not completed Rob's course.
Actionable SignalsBased on Rob Smith from T3Live's "The Strat" system.
Places symbols on inside bars, "Rev Strats", 3-1 "Chicago" setups, "Red Dog Reversals"
Allows creation of alerts for any actionable signal and reversal scenario.
Not recommended for those who have not completed Rob's course.

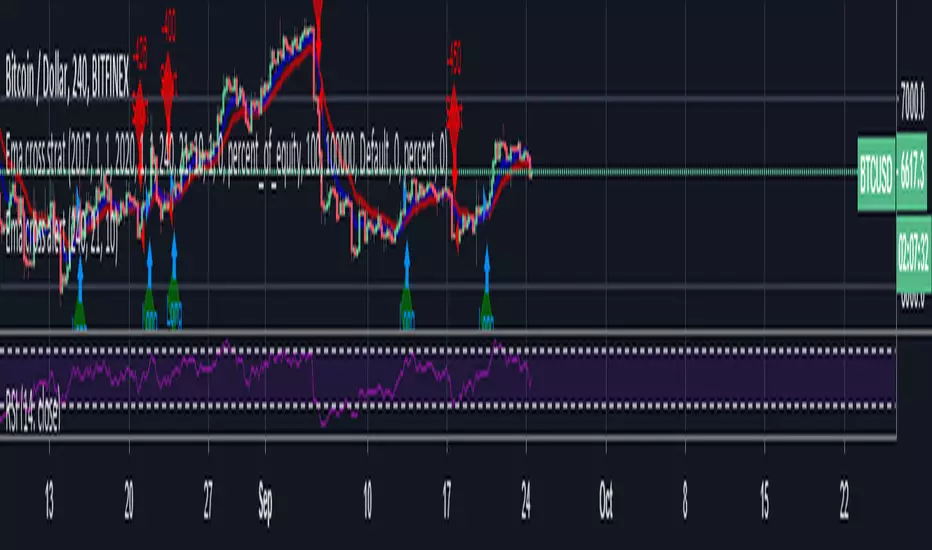
Ema cross strat / Turtle Trading This is just a simple EMA cross strategy which is meant to be similar to Turtle Trading Strategy.
It uses in default 4 Hour 21 / 10 EMA to long or short. This is not perfect but in the long run it will profit. Works best in bull market.
LINK TO ALERT :
Understanding order sizestype: properties manipulation, no programming needed
time required: 15minutes, at least
level: medium (need to know contracts, trading pairs)
A strategy can "appear" to work or be broken depending on the pile of cash that is working on. This amount is defined in the strat properties, under "order size".
For noobs (like me) this is very confusing at first :)
A strat opens/closes positions using units, a generic measure for the chart being operated on. Thes "units" can be a fixed amount of cash, a fixed amount of contracts, or a floating amount based on the last profits made. I recommend checking my previous strat to figure the case of contracts .
So, any trading price is the amount of "things" you get for some "cash". The things are the first unit, the "cash" is the second. Some examples:
XAU/USD - 1 xau oz is worth x dollars
BTC/USD - 1 bitcoin is worth x dollars
GBP/EUR - 1 pound is worth x euros
To add to confusion, a lot of markets the "unit size" is different from what the strat thinks it is. An options contract is 100 shares(the unit), 1 xau contract is 10 oz(units), 1 eur/usd contract is 100k euros and so on... so, after figuring out how the sizes work in a strat, then the sizes must be adapted for the specific market in question.
The choice os using the ETHUSD pair is because:
1 - you can buy 1eth, unlike a gold contract for example, so 1 "unit" = 1 eth, easier to get
2 - ETH is around 12 bucks, wich gives round numbers on the math, easier to wrap the brains around :)
3- is an unusual pair, so the regular contract sizes don't apply, and the brain is not conditioned to work inside the box ;)
You will have to access the script properties, to change the values. As these values are changed you will see exactly the differences in the values of the strat.
Text is too long, check the comments for all the cases
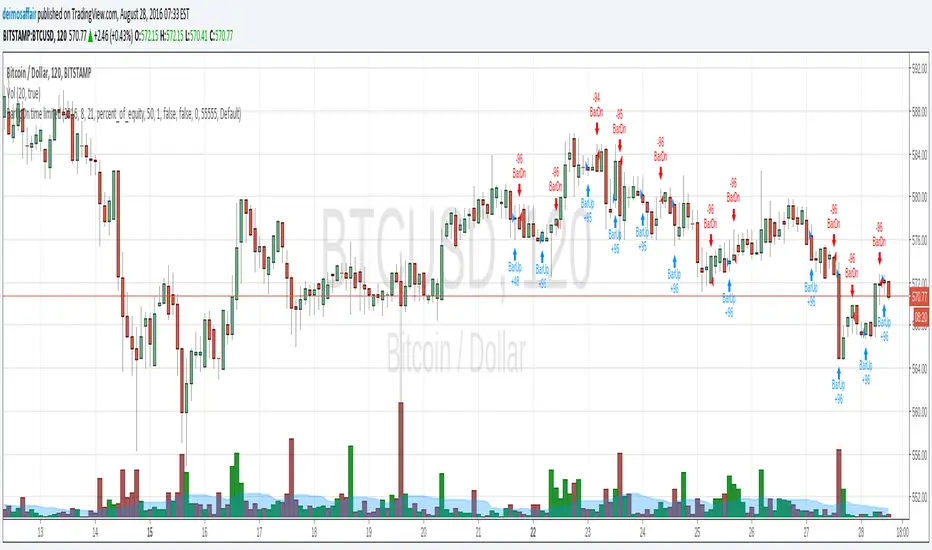
Understanding contract sizes in a strategyThis simple strat fires up on green bars, down on red bars. cannot get any simpler. So, it's a good example to check how returns are calculated.
First, the internal firing mechanism for the strategy.entry function is something hardcore. As result, the entry points can be confusing, and seem to appear in a wrong bar (as the 2nd and 3rd signals are good examples), but i'll put that aside to keep it simple. And, because i don't yet get it myself ;)
The example is simple, so that numbers can be followed easy. Chart in BTC/USD, so USD is the "base" currency used by strat to calculate. A contract/unit is the value of 1 unit in base currency. 1 Apple share is 600$, 1 bitcoin is 600$, 1 oz gold is 1330 bucks. So, here in each bar, the value of 1 contract is the value of the BTC in USD. simple as that.
The strat properties, can be passed as input fields (line 2) or accessed/changed in the right click->properties pop-up. To make it easier, initial capital is 1000 bucks, and "order size" is 1 contract. This means that the strat will open a position of 1 BTC when it fires. Value "Initial capital" makes no difference at all, at least with these choices. It's just for show. Try to put 1$ and 1 contract, the strat will still trade anyway. It manages to trade 1 contract(or BTC) values at ~600$, with a single dollar. nice ;)
Check the chart. see the little blue "BarUp +1" ? that's it, strat goes long 1 BTC. there's a little blue triangle on the bar, points to the value of entry.
Then later, on second move, the "BarDn -2", the strat goes short 2BTC. 1BTC to close the long +1 more to open a short.
The profit here is the difference between the value of the long opening and the long closing. The extra BTC (shorted) is part of the next position. Since this dumb strat just reverses the direction, there are always +2, -2 , +2.... 1 to close previous position, 1 to open another. At the strategy tester tab, the option "list of trades" shows in details each of the moves
Checking each move and comparing what we see with the chart itself helps to achieve ilumination :)
Bonus feature: as soon as you get it, try to increase the option "pyramiding" and see how the strat adds more contracts, and how it reverses the positions. sometimes it even makes sense!!!! :)

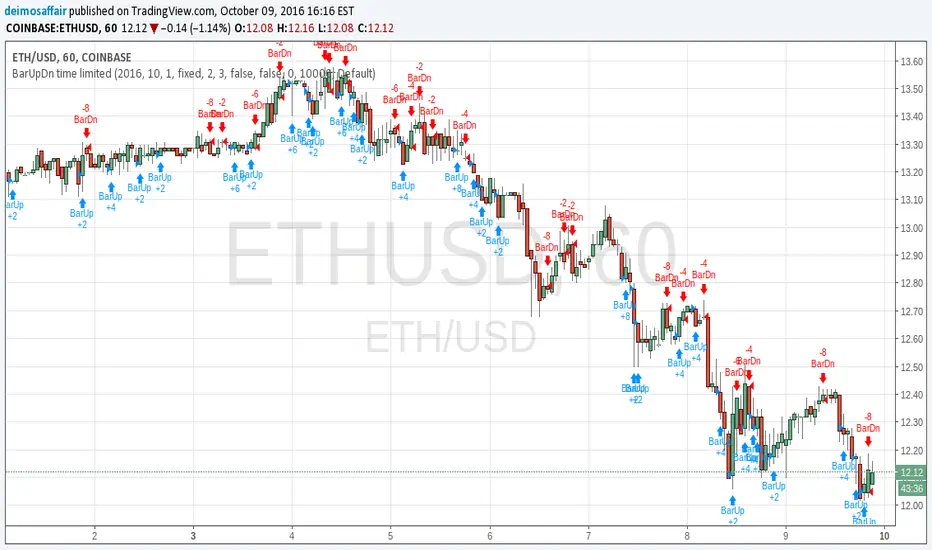
BarUpDn time limitedtrying to understand strategies, it appears that there is a lot of black magic in how a strat works behind the scenes.
anyway, it's hard to analyse what's all the data with one gazillion entries, and i wanted to know how we can manipulate/do stuff with a chart.
so, i needed to know how to "give" the script my values to work on. bundled two wants/needs into one, and created a script that only applies a strategy from the date given onwards.
how to use:
at the chart, go to the "format" little button, then the input tab, and there is all the date fields i created. fun to set it to the current date, then start going backwards and see all the little arrows filing up the chart :)