Stoploss

[ALERTS]Super-Trend & SL/TP V3This simple script analyzes the trend in real time...
Alerts, SL, TP, bla, bla, bla...

MOST by Anıl ÖZEKŞİMOST : Moving Stop Loss Indicator
Developed by economist Anıl ÖZEKŞİ for MATRİKS TRADER platform.
This indicator is like a trailing stop indicator but differs in two ways.
First, trailing stops often uses price bars to determine the stop level, but MOST uses an adjustable percent of the Exponential Moving Average of the price which smooths the sudden price moves.
The second thing is that MOST gives BUY and SELL signals instead of giving one way signals for price action.
MOST has an EMA and a trailing percent stop level of EMA that can be adjusted by changing the length of the EMA and %percent of the stop level.
BUY when ExMoV crosses above MOST
LONG CONDITION when ExMov is above MOST
SELL whenExMov crosses below MOST
SHORT CONDITION when ExMov is below MOST
Developed by Anıl ÖZEKŞİ teknikanalizsanati.com


Zentrading Trend Follower_v1.1For more information on how to use and how to subscribe please visit
www.zentrading.co
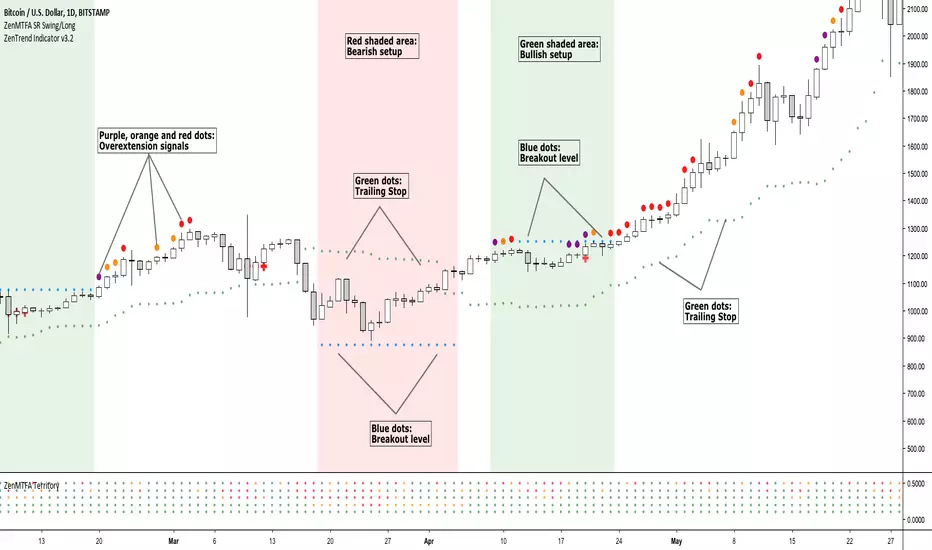
Our ZenTrend Follower is designed to get you into trends in a safe an risk averse manner. It does not only provide you with buy and sell signals forcing you to either react quickly or miss the trade. Rather, our algorithm detects when a trend setup is active and plots a breakout level where you can enter the trade. This also makes it easy for you to scan many assets quickly: All you need to do is see if the indicator has detected a setup, if not, move on!
To ensure that you capture the trend, the indicator indicator shows you where to place your stop loss as the trend progresses. We will also show you a few other simple ways to exit the trades at higher profit levels in the detailed manual you receive after purchasing the indicator.
The shaded areas on the chart indicate that a trade setup has been detected by the algorithm: Green for bullish setups, red for bearish setups. The blue dots are the breakout level, if the price breaks this level the trade is entered. (as you can see on the chart, they can sometimes move towards the price!) Red crosses are plotted as your trailing stop loss, if price breaks the stop loss the trade is closed.


lamBOTghini-ALERTador & SL/TP V3I publish the code again in case someone is interested in learning. I am not an expert, I learned from others who published their scripts and for this reason I do the same.
If someone tries to sell you a script it is because they do not make money with it in trading and they need to sell it to earn something.
It is a simple combination algorithm of 3 EMA with stop loss and Take profit and with alerts.
Enjoy!
¡Mucho ánimo a los Venezolanos!
¡Saludos desde España!


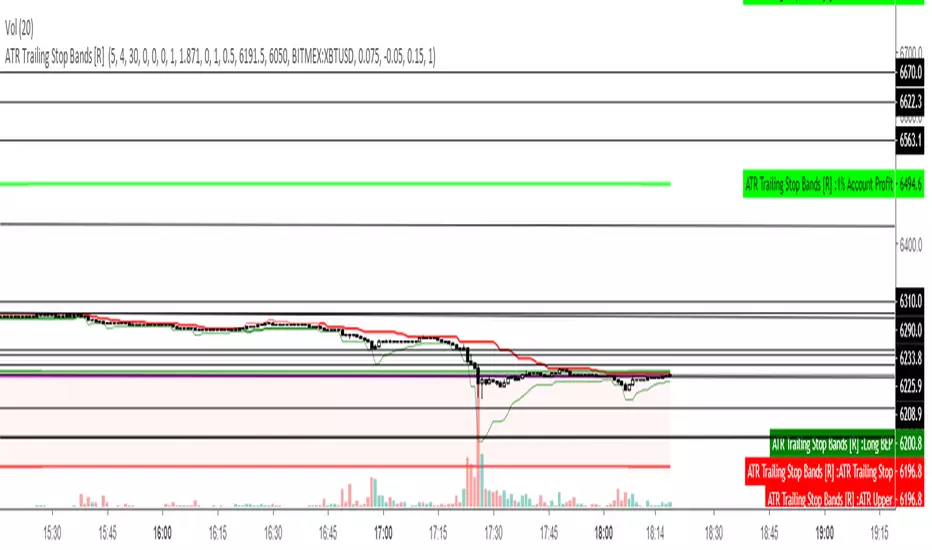
ATR Trailing Stop Bands [R] This is based on the Average True Range Trailing Stops Strategy by Sylvain Vervoort, coded on TV HPotter. I have added Bands to see potential short and long stop loss zones before the indicator signals to switch itself, also changed color on the main Trailing Stop based on whether it is short or long, added increased stop loss hunt protection by combining with my Wickiness indicator to add Wick Protection, based on either Average or Maximum Wicks, to prevent your stop getting wicked out. Experiment with different timeframes according to your trading style and how long you like to hold a trade. This indicator does not intend to tell you when to take profit, just how to place your stop to give you the best chance of not getting stopped out too early and to minimise risk by trailing it safely.
May you all never be stop hunted again.
Adaptive MAs (MAMA, FAMA, KAMA)Adaptive moving averages a.k.a volatility-weighted moving averages are great tools for filtering out whipsawed trades as well as protecting the traders from premature exits when using stoploss. Adaptive moving averages are constructed in such a way that:
1) as volatility increases the sensitivity of the moving averages decreases, distancing the moving averages from price.
2) as volatility subsides, the sensitivity of the adaptive moving average starts to increase, drawing it closer to price action.
References:
stockcharts.com
www.mesasoftware.com
Find me on Twitter .

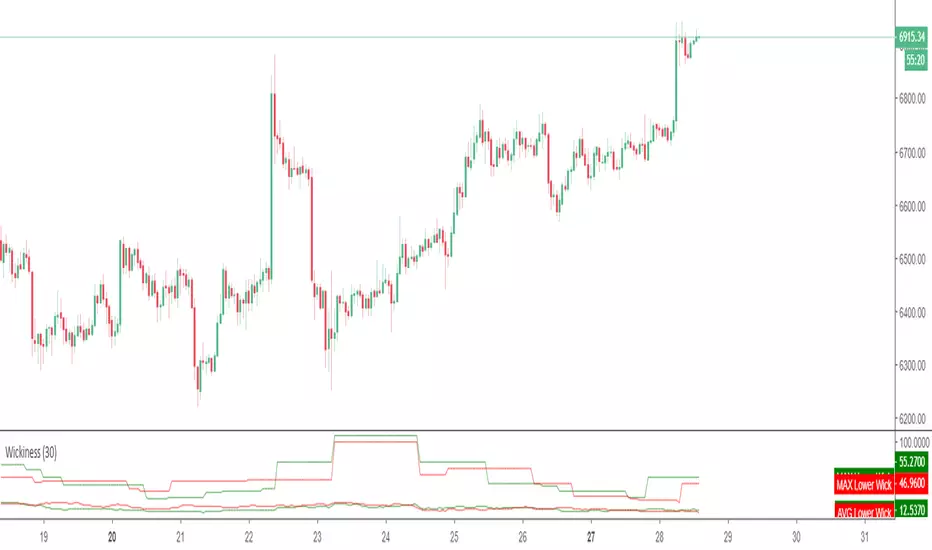
WickinessThis script measures the maximum and average length of upper and lower wicks. While this can be used as a volatility gauge and to see if there is more support or resistance, it's primary use is to not get wicked out on stops, by adding one of these numbers to the the Moving Average or S/R level that one is using for a Stop, plus maybe a few points of buffer.
Donchian Channel with Range AdditionA Donchian Channel with additional zones at places where its range is smaller than a set amount of atr. Thus it kind of combines with Keltner Channel qualities. Purpose is to set a stop loss wide enough to avoid shaking out of a position. The example chart shows a Philips day chart, where I opened position on 16 juli at 37,50 and set the stop loss at low border level 35,60, on 23 juli was an earnings rapport, the wick of the candle shows that quotes went very low, obviously smart traders had to fill a huge order and hunted for stops, triggering my stop closing the position. next days quotes went a lot better, so I missed the fun. The Donchian Channel was too narrow because quotes had ranged in the previous weeks. If I had placed my stop on the additional low, setting it 5 atr below the high border, my stop would have been safe.

BitMex Trailing Stop StrategyThis script is designed for those who want to use BitMex's trailing stop. It's not meant to be used as entry exits, but rather to get an idea of how wide the trailing stop needs to be. I suggest you backtest with different values. The script can also be integrated into an existing strategy which does give entry/exits to act as its stop loss.

ATR stopATR stop loss.
You can set the price at which you want to open position and the script will calculate where to put the stop loss on the ATR.

BottomFinder Adv. Charts Suite V2.0With the advanced charts suite you get multiple indicators you can overlay on your charts, while only using one indicator slot. We made this after requests from our members, to assist those who use a free TV account. IT can take a minute or more to load... be patient! Its not advised to use them all at once, use them in combinations and see what works for you! I wanted to include more indicators, but hit some of the limits imposed by pine script. All options are off by default.
Included are:
Ichimoku Cloud
Support Resistance Fractal
Trailing Long/Short Stoploss
Bull Bear Squares
Triple Hull Moving Average
Standard Hull Moving Average
Fibonacci Daily
Advance Decline Lines
This indicator is available to all our members at no extra charge. If you would like access join us in the link from my signature. You can get a trial of our paid indicators and access to the free ones as well.
Please also like this indicator, and follow me on TradingView for access! We have many more great free indicators coming in the future!

DYNAMIC SUP/RES 1.0Dynamic Support / Resistance Indicator. Good for scalping ranging price action and detecting breakouts.
White area represents current range. Red lines are Stop Loss levels based on range and Risk to Reward ratio of choice.
Free to use for Cryptosurge discord members: discord.gg
Trade safe and DYOR.

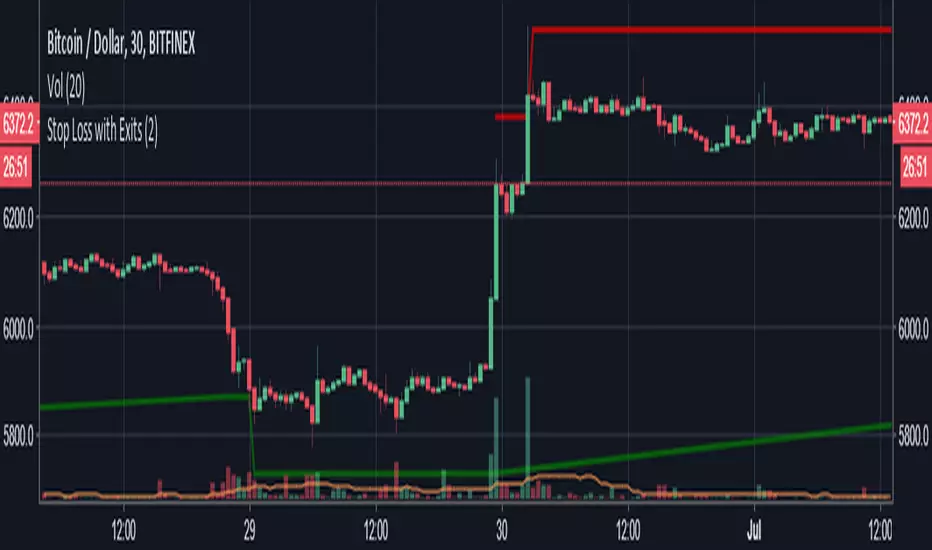
Stop Loss with ExitsStandard Percentage-based Stop Loss for long and short, with configurable extra exit conditions.
Just copy/paste into your script.
Uses "low" and "high" values for crossing the stop loss threshold, but can be changed to "close" if you prefer (change "low" and "high" on lines 31 and 32 to "close")
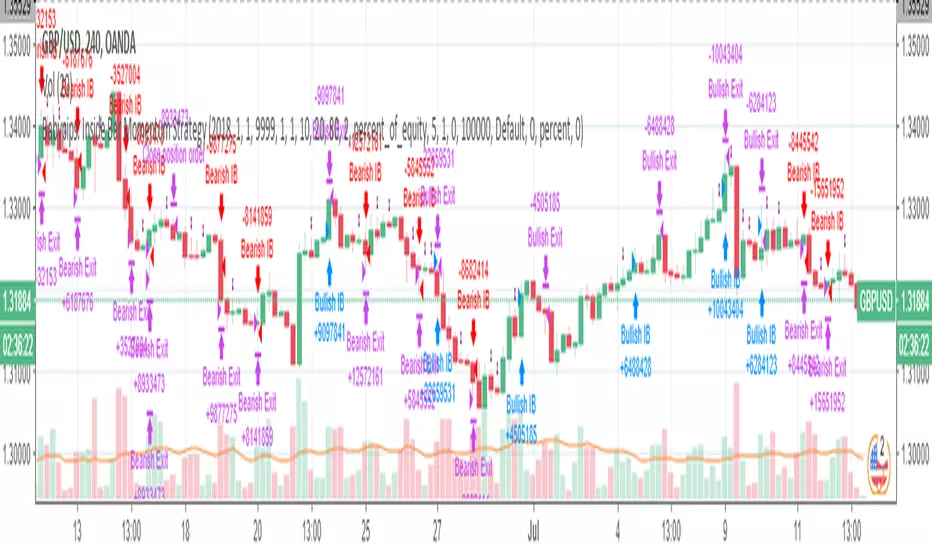
Babypips: Inside Bar Momentum StrategyThe strategy contained in this post comes courtesy of babypips (.com), an excellent resource for all thing forex related. If you are new to trading, the site is definitely worth checking out!
Code commentary and an introduction to Inside Bars are available for this post on the Backtest-Rookies (.com) website.
Note: If you are interested in custom development services, please check out our services page on the Backtest-Rookies site.
Strategy Overview
Inside Bar Momentum Strategy.
Inside Bar Detection
Position sizing based on stoploss distance ( Note: Based on equity and assumes that the account currency is the counter currency.
Stop buys for entries
Takeprofit / Stoplosses for exits
Control Stopbuy, Takeprofit and Stoploss targets with inputs
Control Backtest start/end dates
Double EMA with stop loss indicatorThis is an updated version of my previous stop loss script.
I've added a double EMA line and modified the stop as below;
In an uptrend....
1. a yellow dot will appear once it's time to move your stop. The yellow dot will display at the level of the stop loss. Place your stop 1 pip below the dot.
2. The yellow dot will only appear if a new higher low has formed and has been confirmed. Also the current candle must have broken the high of a previous bullish candle or the dot will not appear.
3. The dot will also appear if there is a likely reversal of the current trend.
Also works in downtrends.....

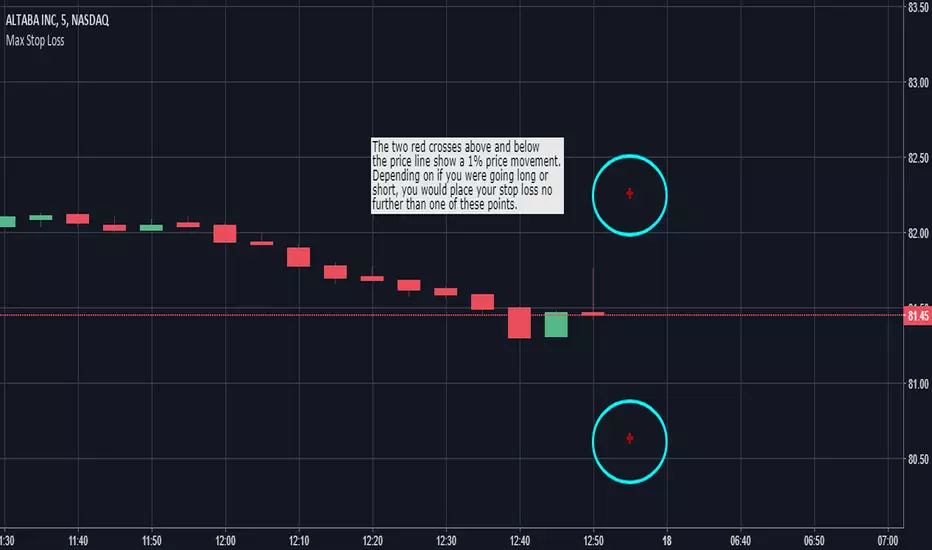
Max Stop Loss - Risk Management VisualizerThis indicator helps traders implement proper risk management in their trading. For example, let's say that you were trading a $1,000 account and didn't want to risk more than 1% of your account on any one trade. If you were placing $100 positions, you wouldn't want the price to move more than 10% against you (10% of $100 is $10, which is 1% of $1,000). So, assuming you were trading without any leverage, you would put "1000" into the "Max Stop Loss %" field in the format box and the indicator would display red crosses 10% above and below the current price of the market you are looking at. If you were going to take that same trade with 10x leverage, you would want to enter "100" into the indicator's format box and the red crosses would then plot themselves 1% above and below the current price.
"Max Stop Loss - Risk Management Visualizer" is able to show all the way down to a 0.01% price variation with no upper limit.