PpSignal Haiken Ashihere is the development of ppsignal Heiken Ashi with a formula of ours.
It also has a Smooth move average.
When HA this green is buying, when red is selling... simple entry system for scalping.
Enjoy it
Akcje

[fareid] Quick Backtest Framework█ OVERVIEW
This Framework allows Pine Coders to quickly code Study() based signal/strategy and validate its viability before proceed to code with more advance/complex customized rules for entry, exit, trailstop, risk management etc..
This is somewhat an upgraded version of my earlier personal template with different strategy used, cleaner code
and additional features.
█ USE CASES
- You have an idea for trade signal and need a quick way to verify its potential before writing lengthy/complicated code
- You found a study script for trading signal in public library and want to validate it profitability with minimum effort before including it in your trading playbook
█ FEATURES
- Alert: Ready to use alert function based on signals from your custom indicator.
- Visual Backtest: Auto-plot entry, stop-loss and take profit for simple strategy performance analysis
- Backtest Statistic: Provide basic key metrics based on backtest strategy
- BTE External Signal Protocol: Ready to use code that will supply required state to PineCoders Backtesting & Trading Engine if you wish to have more advance and sophisticated backtesting engine
Notes: All of the above features have On/Off toggle
█ Description & How To Use
This Framework consist of 5 Modules but you only need to edit the first 2 Modules:
Module1: Indicator
Module2: Framework Input Protocol
Module3: Alert
Module4: Backtest
Module5: Backtest & Trading Engine
Tips: The source-code includes collapsible block by module for easy navigating
Module1: Indicator:
-----------------------------------------------------------------------------------
Main Module. Place custom indicator input parameter/calculation/indicator plotting here
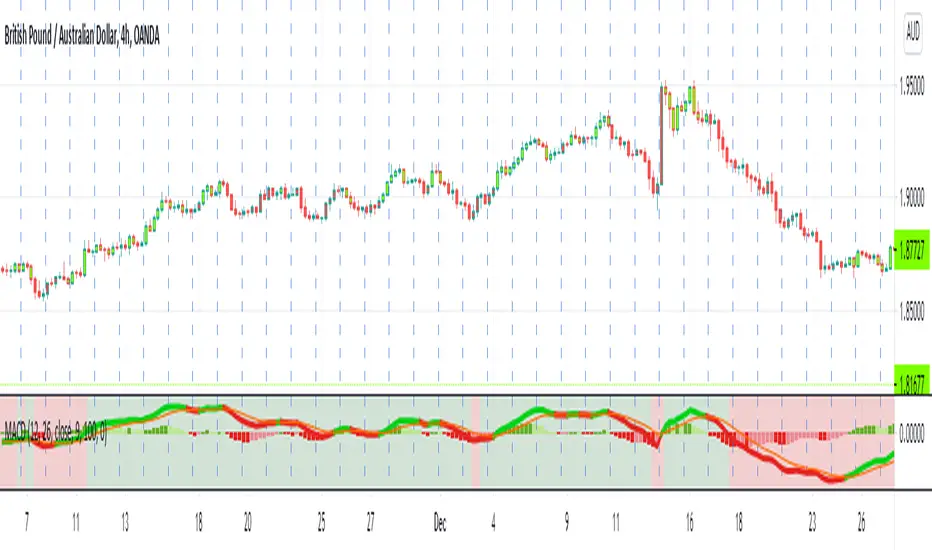
Sample Strategy: Double MACD Crossover
MACD Signal: 1st MACD Cross above signal line indicate Buy Signal
1st MACD Cross below signal line indicate Sell Signal
MACD Filter: 2nd MACD is above 0 line indicate Uptrend
2nd MACD is below 0 line indicate Downtrend
Module2: Framework Input Protocol:
-----------------------------------------------------------------------------------
Use this module to connect main indicator/signal calculated in Module1 to the rest of the framework's module
4 variables needed to be defined here:
1. Uptrend
2. Dntrend
3. BuySignal
4. SellSignal
i'm not sure how to place a code snippet here to show you example so in the source code i already put a comment in Module2 on which part u need to edit. I hope its pretty simple to use.
Module3: Alert Module Description:
-----------------------------------------------------------------------------------
As long as the variables in Module2 properly defined, the alert module is ready to use without any further modification.
Input:
Enable Alert --> Enable TV's alert and plot signal to chart
Alert Type --> Set to take Buy only, Sell only or Both alert
Module4: Backtest Module Description:
-----------------------------------------------------------------------------------
As long as the variables in Module2 properly defined, the backtest module is ready to use without any further modification.
Input:
Backtest Stat --> Enable Backtest Statistic Label
Backtest Visual --> Enable Backtest visual simulation
Backtest Type --> Set to take Buy only or Sell only or both
SL Type -->
ATR : Set SL in ATR times Multiplier below entry price
Fixed : Set SL in fixed point below entry point (in 'Dollar'). e.g. for Stocks -> 0.5 equals to 50cent while for EURUSD currency -> 0.005 equal to 50 pips
HiLo Bar: Set SL at highest/lowest wick of previous bar plus/minus Fixed point. e.g. EURUSD HiLo=3 and Fixed Point = 0.0005, buy trade will place SL 5 Pips below lowest of previous 3 bar
SL ATR Multi --> Set Lookback Period used for SL's ATR calculation
SL ATR Multi --> Set ATR Multiplier for SL
SL Fixed --> Set Fixed Level for SL
SL Bar --> Set Number of previous bar to check for SL placement
TP RR Ratio --> Set TP based on RR multiplier. e.g. 2 means TP level will be twice further from entry point compared to Entry-SL distance.
Notes: The point is for preliminary testing, so it only supports 1 trade at a time and no Trailing Stop
Module5: Backtest & Trading Engine Description:
-----------------------------------------------------------------------------------
As long as the variables in Module2 properly defined, the Pinecoders BTE module is ready to use without any further modification.
Input:
External Signal Protocol --> Set ESP State to send to "Backtesting & Trading Engine "
Signal With Filter --> Use this to send entry signal that already filtered by this study indicator (without stoploss level)
Signal Without Filter --> Use this to send raw entry signal that are NOT YET FILTERED by this study indicator (without stoploss level)
Signal and Stop With Filter --> Use this to send entry signal WITH StopLoss that already filtered by this study indicator (with stoploss level)
Signal and Stop Without Filter --> Use this to send raw entry signal WITH StopLoss that are NOT YET FILTERED by this study indicator (with stoploss level)
Notes: Backtesting & Trading Engine already have built-in Filter, Entries and Stop Level. e.g. Unselect all their filter state if only want to use custom filter and make sure send Signal with Filter (with or without SL level)
█ DISCLAIMER:
This framework main objective is to create my personal indicator template so that i just have to modify the indicator module for preliminary testing in future.
The sample strategy included are for educational purpose only. Use at your own risk
credit: LucF/PineCoders for a lot of his scripts that i use as a guide to complete this

MavilimW Strategy MTF EMA with HA CandlesThis is a strategy adapted initially for Mavilim moving average indicator, based on WMA MA.
It seems to works amazingly on long term markets, like stocks, some futures, some comodities and so on.
In this strategy, I form initially the candle, using EMA values, so I take the EMA of last 50 closes, open, highs and lows and form the candle
After this I take interally HA and convert the EMA candle to HA.
Then using the moving averages on multiple timeframes, like in this example we have a chart on 4h, but I use 1h and 1d moving averages.
For long condition we have : close is above moving average timeframe1 and oving average timeframe2 and oving average timeframe3
Initially short would be close below ma timeframe1, ma timeframe2 and timeframe3 -> but here I also convert it into a long signal.
So we actually go only long .
And we have 2 different exits : for first long if we have a crossdown of 1h ma with 1 day ma, and for second long if we have a cross up of 1h ma with 1 day ma in this example.
Message me if you have any questions about this strategy.

Heiken Ashi MTF Strategy- IndicatorHello, this is both a strategy and indicator that revolves around Heikin Ashi candles.
In this case we take 3 different time frames, in this example we use daily , weekly and monthly.
The conditions for entry are :
For long : we check that we have a green daily candle, at the same time we check that the weekly and monthly candles are also green.
For short : We check that all candles, daily, weekly and monthly and red.
For exit of long : as soon as 1 of the 3 candles, daily or weekly or monthly converts to red, we exit.
For exit of short : as soon as 1 of the 3 candles converts to green, we exit.
This strategy- indicator can be adapted to any type of market.

Profit MAX MTF HeatMapThis is a powerfull strategy which is made from combining 3 multi timeframes into one for profit max indicator
In this case we have daily, weekly and montly.
Our long conditions are the next ones :
if we have an uptrend on all 3 at the same time, we go long.
If we have a downtrend on all 3 of them at the same time we go short.
For exit, for long, as soon as one of the 3 converts into downtrend we exit the trade.
For exit, for short, as soon as one of the 3 converts into uptrend we exit the trade.
This tool can be used on all types of markets, and can also be changed the time frames.

Quansium Series A BacktestThis comes with preconfigured setups or strategies. Simply choose one from our list based on the timeframe it was made for. Leverage can be changed; to keep trading safe, a maximum of 2 is allowed. In our findings, this was able to trade crypto (specifically BTC ), MES (Micro E-mini S&P 500 Index Futures ), and stocks. It is important to know that setups A, B, C, and D use variable position sizing, and dynamic stop loss/trailing stop/take profit, these parameters are provided through the alerts. The rest of the strategies were created with a simpler approach in mind, just plainly entry/exits signals.
Quansium as a framework:
Price reformat: we take the price source (Open, Close, High, Low) and remove any noise that affects the accuracy of our signals.
Time awareness: we take several time periods of the data on the chart such as start, end, and whole. We use this to add more depth to our signals.
Position size: our backtest tries to recreate as much as the real world trades as possible so our position is determined by the current equity. We also use the volatility of the market to increase or decrease our exposure or risk.
Risk awareness: stop loss, take profit, trailing stop are the risk exits we use to provide our users some peace of mind. These parameters are totally dynamic and follow the same behavior of the market.
Signals filtering: to make almost non-existent any errors and increase the quality of our trades, our indicators go through multiple phases, this avoid double entries or early exits, and help maintain a record of what has transpired and what’s currently taking place.
Indicators: whenever we can we use custom code or our own functions instead of the defaults ones provided. This gives us total control of what we’re trying to achieve. In many cases we tend to combine several indicators’ logic into one creating a more personalized take on it.
Easiness: since we started our main goal has been to provide the easiest and fastest way to alerts’ creation. It has taken us years to reach this level where now we already provide a list of preset strategies so the user doesn’t have to spend much time tinkering with scripts and more on other matters, because we know life is more than just trading.
Raw signals: we provide the option to turn off as much of our advanced features such as stop loss, take profit, trailing stop, dynamic sizing, etc, etc for a simple approach. Trade signals still go through the signals filtering method mentioned above,
Timeframe pairing: we take trading very seriously, by no way we’ll want the user to lose money (although such thing is expected because past results aren’t an indicative of futures ones), through years of experience we have found what are usually common mistakes the user makes, this feature allows us to only activate the strategy if the right timeframe is chosen.
Trend filters: through the years we have improved the arts of the trend. We like to keep things simple but yet powerful. We observe the macro and micro trend of the security. This helps confirm we are entering at the desirable timing. We also incorporate volume and volatility into decision making, we simply programmed it to trade when these are increasing and higher than the average values observed in both the short and long term. Finally we take into account the strength of the pair to make our final choice of whether to enter or wait, and if anything flashes contrary movement then we cancel the upcoming signal and stop monitoring until the next one comes along.
Full automated risk: stop loss, take profit, and trailing stops usually are set in percentages, and optimized even more using the current market behavior to become more adaptive. But always remains some sort of fixation, so the user must choose a value somewhere. This is where our framework shines the most, as previously mentioned before when we take time into our calculations, we use several periods to observe performance and get values that keep our risk exits natural and closest to the flow of the market itself.
Setups:
A: Centered oscillator with the difference of several moving averages with more sensitive settings. Momentum focused.
B: Centered oscillator using simple moving averages. Trend-Following focused.
C: Centered oscillator using smoothed data with the help of faster moving averages. Trend-Following focused.
D: Centered oscillator with the difference of several moving averages with less sensitive settings. Trend-Following focused.
E: Centered oscillator with the difference of moving averages where the standard deviation is applied first. It uses less sensitive settings. Trend-Following focused.
F: Finds the relationship between multiple readings of the price’s relative strength to better pin-point downs and ups. Trend-Following focused.
G: Centered oscillator with the difference of moving averages where the standard deviation is applied first. It uses more sensitive settings. Momentum focused.
H: Multiple centered oscillators using various moving averages. Trend-Following focused.
I: Centered oscillator using simple moving averages. Momentum focused.
Note: The framework is composed of almost 1000 lines of code as compared to each indicator that makes up the setup which is around 10. The power from Quansium doesn't come from the strategies themselves but rather the overall system that turns simple signals into complex and advanced trades.
Strategy Tester:
Initial Capital: chosen value is $20,000, as an approximate to Bitcoin’s ATH (All-Time High). In previous iterations we noticed some trades won’t go through if the capital was less than the ATH.
Order Size: 100% of equity (although the script controls this, and this is of no regards to the results).
Pyramiding: 1, system doesn’t place multiple entries in a row, only one at a time.
Commission: This simulates order execution with custom trading fees. Commissions are turned off by default because this script works in various markets and each operates differently. In order to reach results that are close to real world conditions, it is imperative the user fills this based upon their broker or exchange data.
When we started, we were focused on finding the best indicator, or creating it ourselves. After years we came to realize that the secret is not in which indicator you use but the framework behind it. All strategies have bad, good, best, worst performance periods. The key of a good system is to help keep you safe when it’s down and maximize your potential when it’s up. We hope this material at the very minimum inspires you to keep going and not lose faith, because it is not the smartest who win but those who persevere.

MACD With Trend Filter: Visual Backtest Module TemplateSample Strategy: MACD Crossover with trend filter options
MA Filter : Price Close Above MA, Search for Buy, Price Close Below MA, Search for Sell
ADX Filter : Take trade only when ADX is above certain treshold
MACD Signal : MACD Cross above signal line while under 0 line indicate Buy Signal
MACD Cross below signal line while above 0 line indicate Sell Signal
-----------------------------
Using Alert Module:
Enable Alert --> Enable TV's alert and plot signal to chart
Alert Type --> Set to take Buy only, Sell only or Both alert
----------------------------
Using Backtest Module:
Enable Backtest --> Enable Backtest simulation
Backtest Type --> Set to take Buy only, Sell only or Both
SL Type -->
ATR : Set SL in ATR times Multiplier below/above entry price
Fixed : Set SL in fixed point below entry point (in 'Dollar'). e.g. for Stocks -> 0.5 equals to 50cent while for EURUSD currency -> 0.005 equal to 50 pips
HiLo Bar : Set SL at highest/lowest wick of previous bar plus/minus Fixed point. e.g. EURUSD HiLo=3 and Fixed Point = 0.0005, buy trade will place SL 5 Pips below lowest of previous 3 bar
SL ATR Period --> Set Lookback Period used for SL's ATR calculation
SL ATR Multi --> Set ATR Multiplier for SL
SL Fixed --> Set Fixed Level for SL (Use when SL Type is either Fixed or HiLo Bar)
SL Bar --> Set Number of previous bar to check for SL placement
TP RR Ratio --> Set TP based on RR multiplier. e.g. 2 means TP level will be twice further from entry point compared to Entry-SL distance.
Notes: The point is for preliminary testing, so it only supports 1 trade at a time and no Trailing Stop
----------------------------
Disclaimer:
This script main objective is to create my personal indicator template so that i just have to modify the indicator module for preliminary testing in future.
Testing Alert Module so i can re-use it as template in future study/indicator
Testing Visual Backtest Module so i can re-use it as template in future study/indicator
i believe using Strategy function is a better approach for this but the entry/exit level seems to be hit n miss (at least for me, still trying to figure what i did wrong)
also, i rather code the strategy in other platform where i can use the more accurate tick data if i want to validate backtest statistics.
My study scripts was built only to test/visualize an idea to see its viability and if it can be used to optimize existing strategy.
credit: ADX code are originally from "ADX and DI" by @BeikabuOyaji although i re-wrote so i can have cleaner read and use RMA instead of SMA

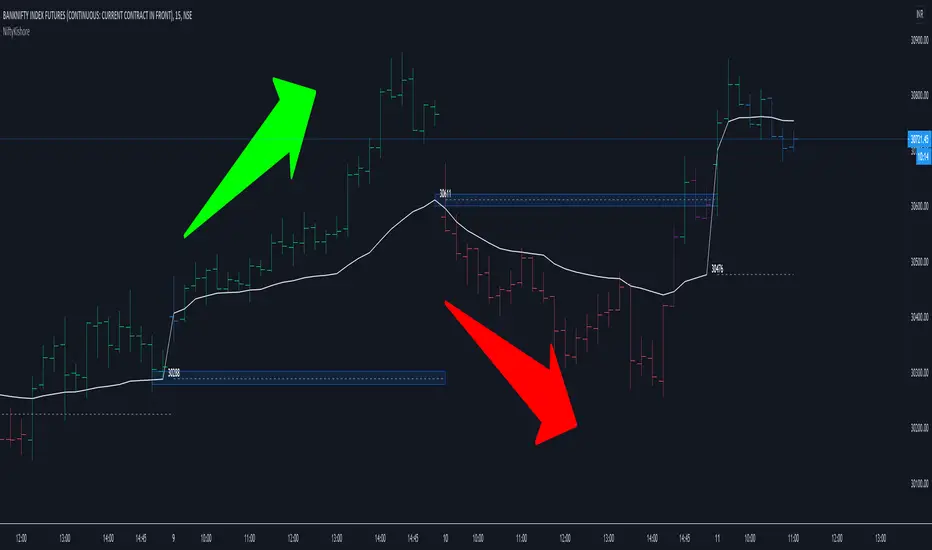
Vwap Pvwap Intraday Trend - NiftyKishoreHello Traders !!
This is a simple trend identification script which is based on the current vwap (Cvwap) and previous vwap (Pvwap).
Pvwap in the sense; previous day vwap closing value.
Bullish: price is closing above the current day vwap and previous day vwap(pvwap).
Bearish : Price is closing below the current day vwap and previous day vwap (pvwap).
Made a change to the barcolors as well :)
Bullish
Green Bar: close is above Pvwap and Cvwap.
Blue bar: close is above Pvwap but below Cwap.
Bearish
Red bar: close is below Pvwap and Cvwap.
Purple bar: close is below Pvwap but above Cvwap.
Simple but effective
Cheers !!
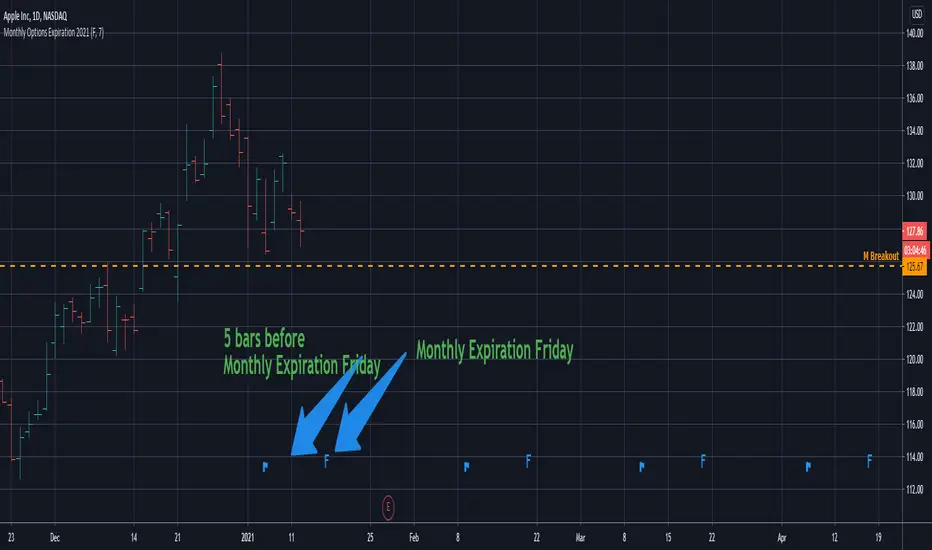
Monthly Options Expiration 2021Monthly options expiration for the year 2021.
Also you can set a flag X no. of days before the expiration date. I use it at as marker to take off existing positions in expiration week or roll to next expiration date or to place new trades.
Happy new year 2021 in advance and all the best traders.
Swing Reversal IndicatorSwing Reversal Indicator was meant to help identify pivot points on the chart which indicate momentum to buy and sell. The indicator uses 3 main questions to help plot the points:
Criteria
Did price take out yesterday's high or low?
Is today's range bigger than yesterday? (Indicates activity in price)
Is the close in the upper/lower portion of the candle? Thus, indicating momentum in that direction
This indicator was built to help me find pivot points for directional options trading however can be used for equities and forex swing trading and other strategies. Used in conjunction with a BB extreme can provide good setups.
Alerts are available for both the long and the short positions and the indicator will repaint as price moves.
The character Plotted can be changed in the settings
The size of the candle area can be changed as well if you want to tighten/loosen the trigger points based on the third question above.

PpSIgnal Quantile Band 4.0Quantile band: In statistics and the theory of probability, quantiles are cutpoints dividing the range of a probability distribution into contiguous intervals with equal probabilities, or dividing the observations in a sample in the same way.
Quantitative Qualitative Estimation is based on a rather complex calculation of the smoothed RSI indicators.
The QQE indicator consists of a smoothed Relative Strength Index ( RSI ) indicator and two volatility-based trailing levels (fast and slow). The Fast Trailing Level (TL) and Slow TL are constructed by calculating the ATR of the smoothed RSI over n-periods and then further smoothing the ATR using an additional n-periods Wilders smoothing function. This smoothed ATR of RSI is then multiplied by the Fast and Slow ATR Multipliers to calculate the final Fast and Slow Trailing Levels.
Buy when the Quantile band is green.
Sell when the Quantile band is red.
when the quantile band is gray hold

GreenCrypto PR Strategy for Swing TradesThis is a very good strategy for Swing Trading, I have been using this strategy for very long time and made good amount of profit using this. This works great for both long trades and short trades, Stop loss and Take profit target is must while entering the trade, this make sure that the trade ends up in good profit and in case if the market revers, ends in only small loss.
This strategy works using the pivot points, we calculate the pivot point using the number of candles mentioned in the input field "leftBars" and "rightBars", if you add more number of bars then the frequency of the trade decreases. for example with the leftBars as 4 you will get less trades than the leftBar=2. Every trade entry is represented using "Buy" and "Sell" signals, whenever there is a new signal chart shows buy/sell signal for limit price, you need to add a limit order for the same price.
Parameters:
LeftBars = Number of left bars should be used for calculating the pivot pints, (more bars means less frequent trades)
RightBars = Number of right candle bars used for calculating the pivot points (more bars means less frequent trades)
Date/month/day : for selecting the right backtesting the period (currently it set to Jan 2018 to current day )
for this backtesting i have used 1000$ capital and with 10% capital used for each trade, free to modify it as per your needs.
This strategy works best on 4H time frame but you can also try backtesting on other time periods.
The default parameters present in the strategy is works best for most of famous cryptocurrencies on 4H time period.
Please DM me if you would like to tryout 7 Days free trail.

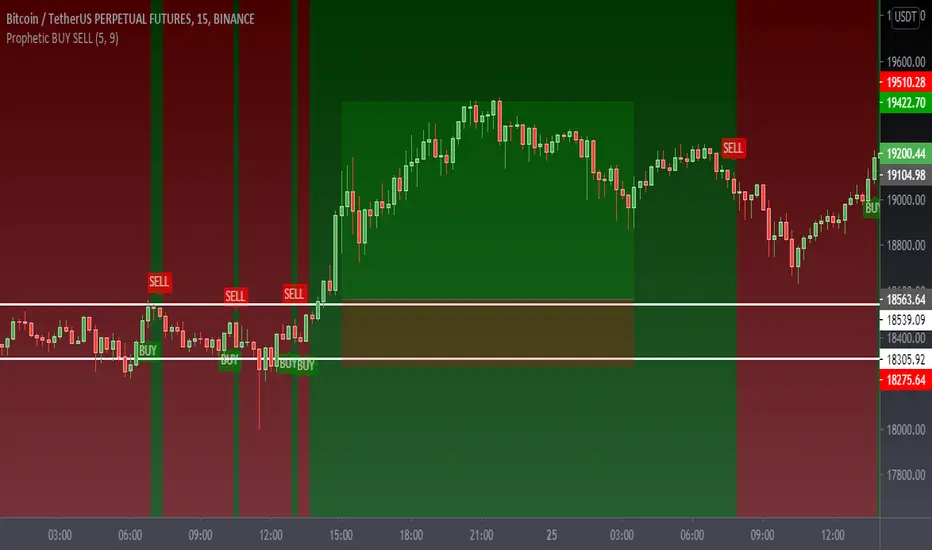
Prophetic BUY SELL IndicatorThis premium indicator will help you to do quick scalping on Cryptocurrencies, Forex, and Stocks.
This indicator is very simple to understand.
Green BUY Alert - Buy Signal Market is up
Red SELL Alert - Sell Signal Market is down
Caution:- Do not use it during market being choppy or sideways
Once the BUY signal appears the background changes green and same with SELL it turns red
can change the color according to requirements
It also has a moving average which also changes the color as the candles close above the MA or the below Default color are green and red
Please Like Share and Follow and if required please contact:- @mobudd (TELEGRAM)
or Ping me on trading view
Guys, It takes effort so please do not ask for free access.
You're always welcome to share any type of suggestion & feedback.
Trendy Bar Trend Color LiteLite version of the original Trendy Bar Trend Color
This will only color the candlestick body of your chart
Can be used with solid, hollow, renko, or any other chart type
Custom coloring for Highs, Lows, and consolidation is removed

Buy/Sell ZonesEN:
This indicator is made to display main buy/sell zones of an asset. The core parameters are: Price, Volume and Donchian Channels.
It is more trend-based and may be suitable for swing traders or those who trade higher timeframes (1D and above).
The plotted colors display the dominance of buyers, sellers or indecision on the market at the current timeframe.
If the zone is green - consider opening Long/Buy positions.
If the zone is red - consider opening Short/Sell or scale out your position.
The white zone displays indecision between Bulls and Bears - consider not to take any trades within white zone.
RU:
Этот индикатор показывает зоны покупателя/продавца выбранного актива. Основные параметры расчета: Цена, Объем и Каналы Дончиана.
Он является индикатором трендового анализа и больше подходит для свинг-трейдеров или тех, кто торгует на старших таймфреймах (от 1Д).
Отображаемые цвета показывают доминацию продавца, покупателя или неопределенность на рынке в конкретный временной период.
Зеленая зона указывает на преобладание покупателя - возможно открытие длинных позиций/покупок .
Красная зона указывает на преобладание продавца - потенциальный момент для открытия коротких позиций/продаж или сокращения своих длинных позиций/покупок .
Белая зона указывает на неопределенность на рынке - в этой зоне лучше не предпринимать никаких торговых решений .
EN: This indicator may be used for Crypto markets
RU: Этот индикатор можно использовать для криптовалютных рынков
BITSTAMP:BTCUSD
BITSTAMP:ETHUSD
COINBASE:COMPUSD
EN: Stocks, CFD and commodities
RU: Акций, CFD и рынков сырьевых товаров
FOREXCOM:SPXUSD
NASDAQ:TSLA
NYSE:BA
NASDAQ:EBAY
FOREXCOM:XAUUSD
EN: Consider using it with respect to Your trading style, money- and risk-management as well as other indicators
RU: Используйте этот индикатор в соответствии со своим стилем торговли, риск-, мани-менеджментом и другими индикаторами.

Swing/Daytrading strategy with reversal option
Hello, today I bring a swing reversal strategy that work on all financial markets.
It uses timeframes starting from 1h, the bigger the better.
Its very dangerous because it has no stop loss, neither a take profit. Our exit condition is based on the reversal on the entry .
For entry we have 2 types : normal and reversal
Lets say we want to go long , for that we check the last CLOSE of a candle with the previos HIGH. If its higher than that, and at the same time CLOSE is bigger than the moving average, we have a long entry.
For short we have CLOSE with the previous LOW. If its lower than that and at the same time is lower than moving average, we have a short entry.
For moving average we use T3 MA
For reversal what I do, is , I take the short condition and I apply it to long, and for long I apply the short condition.
On many cases I found out it work amazingly.
I forgot to add: it also has a time entry system, so we use the best hours/sessions for entries .
Exit a trade: lets say we enter short, when we find a long condition, we close short and enter into long. Viceversa for long.
If you have any questions, let me know.
Enjoy it :)

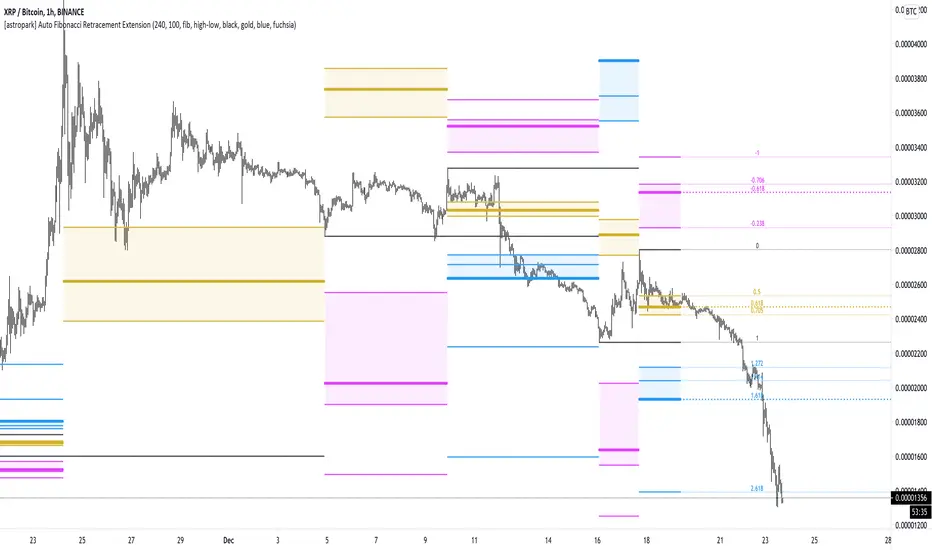
[astropark] Auto Fibonacci Retracement ExtensionDear followers,
today a new analysis tool for day trading, scalping and swing trading: Automatic Fibonacci Retracements and Extensions drawer!
It works on every timeframe and market, as it simply draws automatically most important fibonacci levels on the chart.
Based on the analysis window set (default 100 bars, but you can edit it as you like), it finds recent high and low and start drawing the following levels:
recent high and low (black)
golden retracement range: 0.5 * 0.618 * 0.705 fibonacci retracements (gold)
fibonacci extensions range above 1: 1.272 * 1.424 * 1.618 * 2.618 * 4.236 (blue)
fibonacci extensions range below 0: -0.238 * -0.618 * -0.706 * -1(fuchsia)
Whenever the indicator finds a new high or a new low, al fibonacci levels are re-draw automatically.
The indicator will let you:
change analysis window
enable displaying labels related to current fibonacci levels and/or prices
change colors
show/hide each specific level
How to use the indicator?
Basically, all techniques which apply to fibonacci tool are valid here too.
After a big move up or down, a new high or low is created and a retracement is expected: if trend is strong, retracement to golden ration 0.618 will be a perfect spot for buy or sell respectively in order to continue riding the trend.
In general a bounce is always expected when price hit 0.618 retracement , good to know for scalping traders, while swing trades will continue holding the trade for higher profits.
If the golden retracement range (0.5 - 0.705) is broken and then retested from the other side, a continuation move is expected towards previous high/low (fib level 1) and even more towards the fibonacci extensions range above 1 (1.618 - 2.618 - 4.236).
If the base of bounce and trend continuation on golden retracement range, traders can expect
price to hit again previous high/low and
if trend is strong, a consolidation near the previous high/low range (conditions that are respectively bullish and bearish)
do a further continuation towards -0.618 fib level range
Traders must always understand that
the higher the timeframe, the stronger is the meaning and so the reaction when a specific fibonacci level is hit
don't trade blindly, try to find confluences to have an higher chance to be in a winning trade in near future
money and risk management are very important, so manage your position size and always have a stop loss in your trades
As said, this indicators work on every timeframe and in all markets (Crypto currencies, stocks, FOREX, indexes, commodities). Here some examples:
BTCUSDT 1D: after a long run, a retracement is expected and a bounce at 0.618 golden level is more than obvious: perfect short (sell) entry
BTCUSDT 1D: again as previous example, after a long run, a retracement is expected as well as price's bounces back above
EURUSD 1h: lots of info here, directly in the chart below:
bounces on 0.618 golden zone
double top
price breaks 0.618 level and retests it from below targeting previous low
double bottom and bounce back towards golden zone
bearish consolidation at recent low and further decline towards 1.618 fib extension
AMZN 1h stock: lots of info here too, directly in the chart below:
new high is print, price retrace to golden zone
bounces on 0.618 golden zone
price breaks 0.618 level and retests it from below targeting previous low
double bottom and bounce back towards golden zone
rejection at golden zone, price falling targeting previous low again and probably 1.618 fib extension
price breaks hard previous low and hits fib extension range below recent low
price retraces back up towards new golden retracement range
golden retracement range is broken and used as support: targets are previous high and 1.618 extension
once 1.618 extension level is broken and retested successfully as support, price moves towards 2.618 fibonacci extension level
SPY (SPX500) index: lots of info in the chart
interesting to note that March 2020 huge dump can be totally mapped as a series of fibonacci level bounces, so you understand the importance of riding a trend now, right?
after the low was formed, price retraced perfectly to golden ration 0.618
each time price hit a golden level/range, it retraces creating double top and double bottom configurations too
In the chart below we can see the power of the double bottom at golden retracement level: targets are previous high and -0.618 fibonacci extension level
XAUUSD 15m: as we are in a lower timeframe, the default analysis windows has been reduced to 50.
What can we see here:
golden retracement and price is rejected towards previous low
golden retracement hit and price bounces back lower
new high is formed: golden retracement hit and price bounces back higher
price break previous high and hits fibonacci extensions -0.618 and -1
price continues rising forming a regular bearish divergence with RSI
once uptrend is broken, price falls dramatically
first target is 0.618 retracement level, where you see a very small retracement due to strength of sellers
second target is previous low, which is broken and retested many time from below (bearish retest)
third target is fibonacci extension range (in this case 1.414 is almost hit)
as an hidden bullish divergence with RSI was created, price goes back up
This is a premium indicator , so send me a private message in order to get access to this script.
MACD with 3 strategiesMACD WITH 3 STRATEGIES
- Macd line change colour when cross the signal line
- Background Color change colour based on a moving average, on settings the value of the moving average can be changed 50,100,150,200
- Strategy one based on Macd lines with bar changing colours
- Strategy two based on Macd lines but with a different method
- Strategy three based on two other trending indicators
This indicator can be used to spot trends and changing of direction of the market and with the bar coloured its easier to identify them.
The strategy one can be used as confirmation of a trend or as changing direction integrated with other indicators like Rsi , Stochastic, Supertrend , Bollinger band, with ema option mode works better.
The strategy two can be use together with the back ground colour: When is red and the candles are red can be identified as strong drown trend.
When is green and the candles are green can be identified as strong up trend.
The strategy three can be used after checked the strategy two for more confirmation for a trend.
VERY IMPORTANT WHEN YOU TRY A NEW STRATEGY TEST IT IN A DEMO ACCOUNT FOR AT LEAST 3 MONTHS
Every donations will be devolved to cancer research and you ll have one month free trial.
If you want to purchase this indicator 30% will be devolved to cancer research.
Please leave a comment or message me if you want you have two weeks trial.
Enjoy!
Long only strategy VWAP with BB and Golden Cross EMA50/200
This is strategy, mainly designed for stock markets
It makes uses of the EMA 50/ 200 ( Golden cross) and VWAP and Bollinger bands.
It only takes long positions. It can be adapted to all time frames, but preferably to be used with longer timeframes 1h +
The rules for entry are the next ones :
1. EMA50 > EMA 200
2. if current close > vwap session value
3. check if price dipped BB lower band for any of last 10 candles
EXIT RULE
1. price closes above BB upper
STOP LOSS EXIT
1. As configured --- default is set to 1%

[astropark] DMI/ADX strategy [alarms]Dear Followers,
today I'm happy to share with you my DMI / ADX Strategy .
It provides directional trend information, so if a bullish or a bearish trend is going to start. Statistically it works better on lower timeframes (from 5 minutes to 1 hour).
It is both a Swing and Scalping Strategy indicator , based on a simple trend following theory , good for trading FOREX, Indexes, Stocks, Commodities and Cryptocurrencies.
To help in Taking Profits, the strategy integrates 2 special other than bull/bear signals:
Overbought and Oversold RSI Signals , which appear both as darker background (the darker the color, the more the price is in overbought/oversold) and green "ob"-"tp" / red "os"-"tp" labels (they optionally pop up only on a configurable stronger overbought/oversold condition) (you can enable/disable it optionally)
Peak Profit Tracker , which resets every time a new trade starts and keeps track of price fluctuation during the trade: the message is don't be too greedy and take profits or lock them with a stoploss in profit (you can enable/disable it optionally)
You can edit many options in order to
have more/less bull/bear signals
enable/disable showing bull/bear signals
enable/disable showing RSI TP signals (you can edit RSI length, overbought (OB) and oversold (OS) levels)
enable/disable showing peak profits on each trade
The user who wants to use this strategy, especially via an automated bot, must always set a stoploss (example 150$ from entry on bitcoin ) or use a proper risk management strategy .
This is not the "Holy Grail", so use it with caution. It's highly suggested to use a proper money management .
This script will let you set all notifications you may need in order to be alerted on each triggered signals.
You can find the strategy version for backtesting here below:
Here there are some examples how this DMI / ADX strategy works on many markets:
LTC/USDT 15m
BTC/USD 15m
BNB/BTC 15m
ETH/USD 15m
GOLD (XAU/USD) 15m
GOLD (XAU/USD) 1h
FB 15m
AAPL 15m
TSLA 1h
BANKNIFTY Index 5m
NIFTY 50 Index 5m
This is a premium indicator , so send me a private message in order to get access to this script .

[astropark] DMI/ADX strategy [strategy]Dear Followers,
today I'm happy to share with you my DMI / ADX Strategy .
It provides directional trend information, so if a bullish or a bearish trend is going to start. Statistically it works better on lower timeframes (from 5 minutes to 1 hour).
It is both a Swing and Scalping Strategy indicator , based on a simple trend following theory , good for trading FOREX, Indexes, Stocks, Commodities and Cryptocurrencies.
To help in Taking Profits, the strategy integrates 2 special other than bull/bear signals:
Overbought and Oversold RSI Signals , which appear both as darker background (the darker the color, the more the price is in overbought/oversold) and green "ob"-"tp" / red "os"-"tp" labels (they optionally pop up only on a configurable stronger overbought/oversold condition) (you can enable/disable it optionally)
Peak Profit Tracker , which resets every time a new trade starts and keeps track of price fluctuation during the trade: the message is don't be too greedy and take profits or lock them with a stoploss in profit (you can enable/disable it optionally)
You can edit many options in order to
have more/less bull/bear signals
enable/disable showing bull/bear signals
enable/disable showing RSI TP signals (you can edit RSI length, overbought (OB) and oversold (OS) levels)
enable/disable showing peak profits on each trade
The user who wants to use this strategy, especially via an automated bot, must always set a stoploss (example 150$ from entry on bitcoin ) or use a proper risk management strategy .
This is not the "Holy Grail", so use it with caution. It's highly suggested to use a proper money management .
This script will let you backtest performance of the indicator based on bear/bull signals.
You can find the alarms version by searching for my DMI / ADX Strategy and choosing the "alarms" named.
Here there are some examples how this DMI / ADX strategy works on many markets:
LTC/USDT 15m
BTC/USD 15m
BNB/BTC 15m
ETH/USD 15m
GOLD (XAU/USD) 15m
GOLD (XAU/USD) 1h
FB 15m
AAPL 15m
TSLA 1h
BANKNIFTY Index 5m
NIFTY 50 Index 5m
This is a premium indicator , so send me a private message in order to get access to this script .

Stock Market Strategy : VWAP, MACD, EMA, Breakout, BBHello there,
Today I bring you a stock market strategy, specialized in NASDAQ stocks.
Its a daytrading strategy, that can only do a max of 1 trade per day. In this case it only trades the first 2 opening hours of the market.
The rules are simple :
We follow the trend based on a big EMA, in this case 200, after that, we check for VWAP direction , then, we check histogram from MACD. This is the simple logic of the strategy.
Inside there is another strategy, that not just do the above, but also uses Bollinger bands, and checks for breakout of bottom or top line. Also it uses Average directional Index, for even a bigger criteria .
So for example a long condition it would be : candle is above the ema, and candle is above vwap, and histogram is positive, and candle break the top bb level and ADI < 40 -> long signal . The opposite works for short(ADI > 20).
In this case all this criterias are between the first 2 hours of market. So we enter between the first hour, and exit in the next hour. For this we need to use very short time frames.
Hope you enjoy it.
Let me know if you have any questions

Ichimoku with MACD/ CMF/ TSI This is a strategy made from ichimoku cloud , together with MACD, Chaiking Money FLOW and True Strenght Index.
It can be adapted to any timeframe and any type of financial markets.
The idea behind its very simple,
We combine the long / short strategy from ichimoku, like cross between lines and below/above cloud together with histogram from MACD for positive/negative level. We use the same criteria for TSI and CMF, to check if its above or below 0 level.
Based on that we have a long or a short entry. The exit happens when the next options triggers, like for example we had long signal, we exit when we receive the short signal and viceversa.
It can be adapted with a risk management to apply a tp/sl level.
For any suggestion or details , let me know.
