Altseason Index | AlchimistOfCrypto
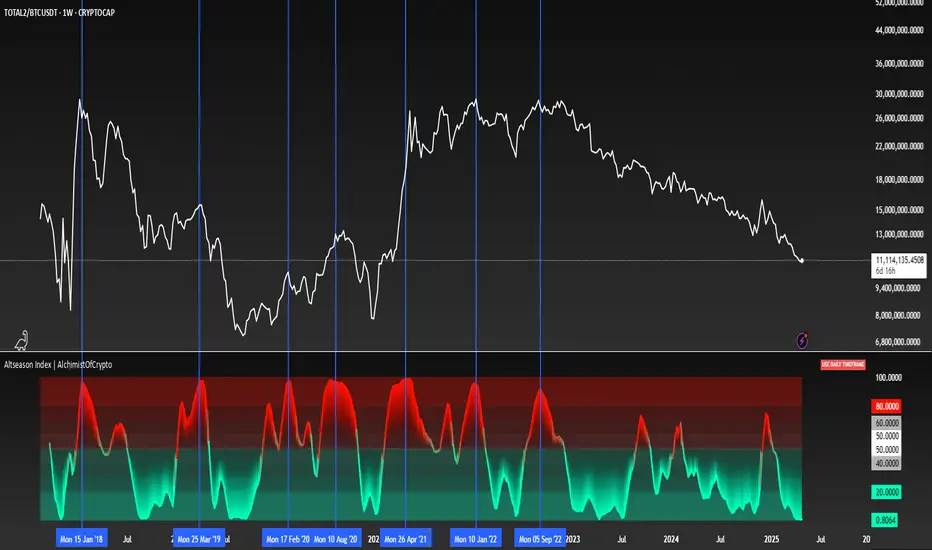
🌈 Altseason Index | AlchimistOfCrypto – Revealing Bitcoin-Altcoin Dominance Cycles 🌈
"The Altseason Index, engineered through advanced mathematical methodology, visualizes the probabilistic distribution of capital flows between Bitcoin and altcoins within a multi-cycle paradigm. This indicator employs statistical normalization principles where ratio coefficients create mathematical boundaries that define dominance transitions between cryptographic asset classes. Our implementation features algorithmically enhanced rainbow visualization derived from extensive market cycle analysis, creating a dynamic representation of value flow with adaptive color gradients that highlight critical phase transitions in the cyclical evolution of the crypto market."
📊 Professional Trading Application
The Altseason Index transcends traditional sentiment models with a sophisticated multi-band illumination system that reveals the underlying structure of crypto sector rotation. Scientifically calibrated across different ratios (TOTAL2/BTC, OTHERS/BTC) and featuring seamless daily visualization, it enables investors to perceive capital transitions between Bitcoin and altcoins with unprecedented clarity.
- Visual Theming 🎨
Scientifically designed rainbow gradient optimized for market cycle recognition:
- Green-Blue: Altcoin accumulation zones with highest capital flow potential
- Neutral White: Market equilibrium zone representing balanced capital distribution
- Yellow-Red: Bitcoin dominance regions indicating defensive capital positioning
- Gradient Transitions: Mathematical inflection points for strategic reallocation
- Market Phase Detection 🔍
- Precise zone boundaries demarcating critical sentiment shifts in the crypto ecosystem
- Daily timeframe calculation ensuring consistent signal reliability
- Multiple ratio analysis revealing the probabilistic nature of market capital flows
🚀 How to Use
1. Identify Market Phase ⏰: Locate the current index relative to colored zones
2. Understand Capital Flow 🎚️: Monitor transitions between Bitcoin and altcoin dominance
3. Assess Mathematical Value 🌈: Determine optimal allocation based on zone location
4. Adjust Investment Strategy 🔎: Modulate position sizing based on dominance assessment
5. Prepare for Rotation ✅: Anticipate capital shifts when approaching extreme zones
6. Invest with Precision 🛡️: Accumulate altcoins in lower zones, reduce in upper zones
7. Manage Risk Dynamically 🔐: Scale portfolio allocations based on index positioning
Statistics
Max RR CalculatorAutomatically calculates the maximum RR reached during trade. Entry is at the candle close. There is an option available that takes another trade after getting stopped out on the next candle that is in same bias as first trade.
(If the first trade is a long and gets stopped out, then the second trade will wait until the next up candle to enter long again)

[Stop!Loss] ADR Signal ADR Signal - a technical indicator located in a separate window, which displays by default the 80%-level , as well as the 100%-level of the average daily range (ADR) for the last 10 days and compares it with the current intraday range. The indicator helps not only with the use of a mathematical-statistical method to identify a potential reversal at the moment during intraday trading, but can also serves as an effective assistant in risk management.
👉 Basic mechanics of the indicator
Firstly, this indicator tracks the performance of the standard ATR indicator on the daily chart, in other words, ADR (Average Daily Range).
Important ❗️The ATR (Average True Range) indicator was created by J. Welles Wilder Jr. He first introduced ATR in his book "New Concepts in Technical Trading Systems", published in 1978. Wilder developed this indicator to measure market volatility to help traders estimate the range of price movements. This indicator is built into TradingView, more details can be found by link: www.tradingview.com
Like ATR , ADR calculates the average true range for a specified period. In this case, the distance in points from the maximum of each day to its minimum is calculated, after which the arithmetic mean is calculated - this is ADR .
👉 Visualization
ADR Signal is located in a separate window on the chart and has 3 levels:
1) "ADR level" (green line) - the same parameter, the calculations of which are briefly described above. There is 100%-level of ATR on the daily chart (ADR).
2) "Current level" (red line) - this is the current price passage within the day, calculated in points. At the start of a new day, this parameter is reset. Therefore, in the indicator window, this line has sharp drops at the start of a new trading day: "A new trading day - the instrument's power reserve is renewed again".
3) "Signal level" (blue line) - this is an individually customized value that demonstrates a certain part of the ADR parameter.
👉 Inputs
1) - is responsible for the ATR indicator period, the value of which will always be calculated on the daily chart. The default value is "10", that is, ATR is calculated for the last 10 days (not including the current one).
2) - signal level (in %). The default value is "0.8", that is, 80%-level of the ADR parameter (set earlier) is calculated.
👉 Style
1) - by default, this level is colored "blue".
2) - by default, this level is colored "red".
3) - by default, this level is colored "green".
👉 How to use this indicator
Important❗️ The two methods of the use of the ADR Signal indicator described below will be most effective when trading intraday (which is highlighted quite well below), so it is more logical to use the indicator information on time periods H1 and below.
1) Identifying potential reversals during intraday trading:
The ADR Signal indicator can be used as a potential individual reversal strategy.
Important ❗️It should be noted that using it in it without additional confirming analysis tools will be a rather aggressive trading approach. Therefore, it is best to support the entry point in particular with other methods.
In this case, the crossing of the red line (the number of points passed within the current day, that is, from the minimum of the current day to its maximum) and the blue line (color of the Signal level based on the default settings), indicates that the trading instrument has passed 80% (based on the default settings for the "Signal level") of its average distance from the maximum to the minimum over the past 10 days (based on the default settings for the "ADR Length"). Such a situation in the context of the mathematical-statistical approach indicates a probable reversal, since the "power reserve" of this instrument is mostly exhausted, so one can expect with a higher probability, at least, a price stop and possibly a reversal. In case of crossing of the red line and the green one (ADR level), it says again that based on the mathematical-statistical approach, this trading instrument has completely exhausted its intraday "power reserve". In this situation, a stop or reversal of the price will be even more likely.
Of course, using the "Signal level" parameter, one can filter out even more reliable situations for potential price reversals within a day, namely, by specifying, for example, 1.5 in the field of this parameter. Under such conditions, in the case of crossing the red and blue lines (based on the default style settings), to say that the trading instrument has passed 150% of its average distance over the last 10 days (based on the default style settings "ADR length"). In this case, the probability of a stop or reversal of the price increases even more.
2) Use in risk management:
In terms of risk management, this indicator is more applicable to open trades. For example, if one had an open Buy-position (especially if it is an intraday trade) and the price has raised significantly during the day, then the crossing of the red line with the blue line , and especially the red line with the green line , may indicate that the price will most likely stop growing, since the "power reserve" is almost or completely exhausted for this instrument within the current day. In this case, one can, at a minimum, move the trade to breakeven or even partially fix the profit.
We will continue to discuss the methods of using this indicator and strategies based on it here. And we are always waiting for your reactions and feedback on this topic 💬.
Thank you for your support 🚀

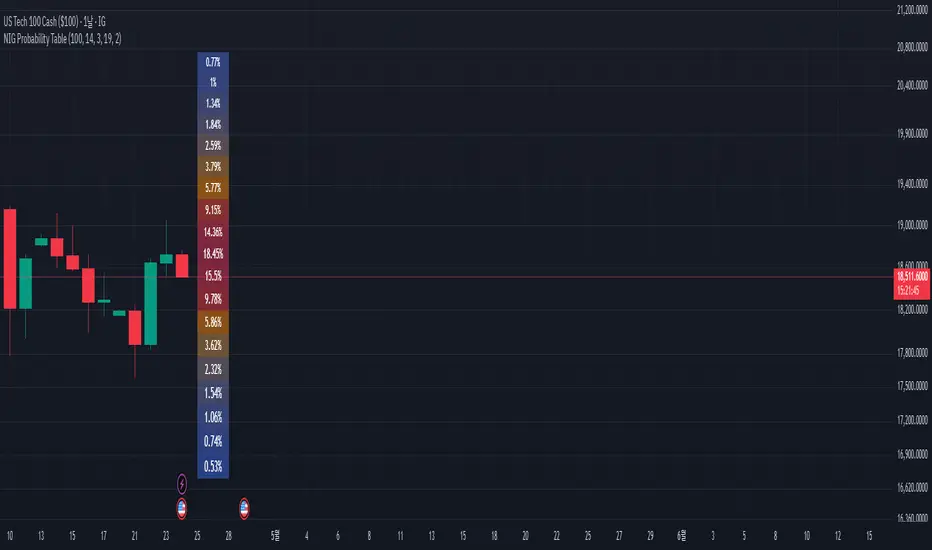
NIG Probability TableNormal-Inverse Gaussian Probability Table
This indicator implements the Normal-Inverse Gaussian (NIG) distribution to estimate the likelihood of future price based on recent market behavior.
📊 Key Features:
- Estimates the parameters (α: tail heaviness, β: skewness, δ: scale, μ: location)
of the NIG distribution using a sliding window over log returns.
- Uses a numerically approximated version of the modified Bessel function (K₁)
to calculate the NIG probability density function (PDF).
- Normalizes the total probability across all bins to ensure the values are interpretable.
- Displays a dynamic probability table showing the chance of future returns falling into each bin.
⚠️ Notes:
- This is a real-time approximation. The Bessel function and posterior inference are simplified.
- Tail probabilities and shape parameters are sensitive to the window size and input settings.
- Useful for risk analysis, option overlays, and strategy filters.
LAOS Gold Price in LAK By LSENMany people in Laos are confused about the actual price of Gold in local currency.
This script provides a simple and live updating way to convert the international gold price (XAU/USD) into Lao Kip Currency in BAHT-weight gold (15.244g).
By default, it uses an exchnage rte of 21,000 KIP = 1 USD, But you can easily customize the rate to fit your needs.
-See things as they truly are. Suffering arises when you try to resist reality. Don't let greed and FOMO fuel the fire.
ຂໍໃຫ້ທຸກທ່ານໂຊກດີ

Log-Normal Price ForecastLog-Normal Price Forecast
This Pine Script creates a log-normal forecast model of future price movements on a TradingView chart, based on historical log returns. It plots expected price trajectories and bands representing different levels of statistical deviation.
Parameters
Model Length – Number of bars used to calculate average and standard deviation of log returns (default: 100).
Forecast Length – Number of bars into the future for which the forecast is projected (default: 100, max: 500).
Volatility SMA Length – The smoothing length for the standard deviation (default: 20).
Confidence Intervals – Confidence intervals for price bands (default: 95%, 99%, 99.9%).

Daily Levels & Stats Pro - [Aspect] v4.0# Description of the "Daily Levels & Stats Pro - v4.0" Indicator
This indicator is a powerful tool for market analysis through the lens of key daily levels and statistical price movement indicators. It allows you to display important trading session opening levels, daily statistical movements, and high volatility zones on the price chart.
## Main Indicator Functions:
### Key Time Levels:
- **Daily Open (DO)** - daily trading session opening level at 02:00
- **NY Midnight (NYM)** - New York session opening level at 06:00
- **Trade Open (TO)** - active trading opening level at 10:00
### Analysis Zones:
- **Previous Close Zone (PCZ)** - previous day's closing zone (displayed on M5 timeframe)
- **Open Day Zone (ODZ)** - current day's opening zone (displayed on M5 timeframe)
### Statistical Price Movement Levels:
- **Min** - minimum statistical movement from DO
- **Max** - maximum statistical movement from DO
- **Aver** - average statistical movement from DO
- **Dev-** - lower deviation of movement from DO
- **Dev+** - upper deviation of movement from DO
### TO Impulse Movement Statistical Levels:
- **Aver TO** - average statistical movement from TO
- **Dev+ TO** - upper deviation of movement from TO
- **Max TO** - maximum statistical movement from TO
## Indicator Features:
- Complete customization of colors, styles, and line widths for all levels
- Ability to select time for each main level
- Adjustment of the number of bars for level display
- Automatic calculation of level values relative to DO and TO
- Visual display of TO-levels starts 3 bars before the actual TO point, providing better visual perception
- Ability to enable/disable individual levels and zones
- Automatic updates and resets when the day changes
- Adaptive text labels to mark levels
This indicator is excellent for traders who use statistical data and daily support/resistance levels in their trading strategy. It is particularly useful for DAX40 and other highly liquid instruments where daily trading statistics are important for making trading decisions.

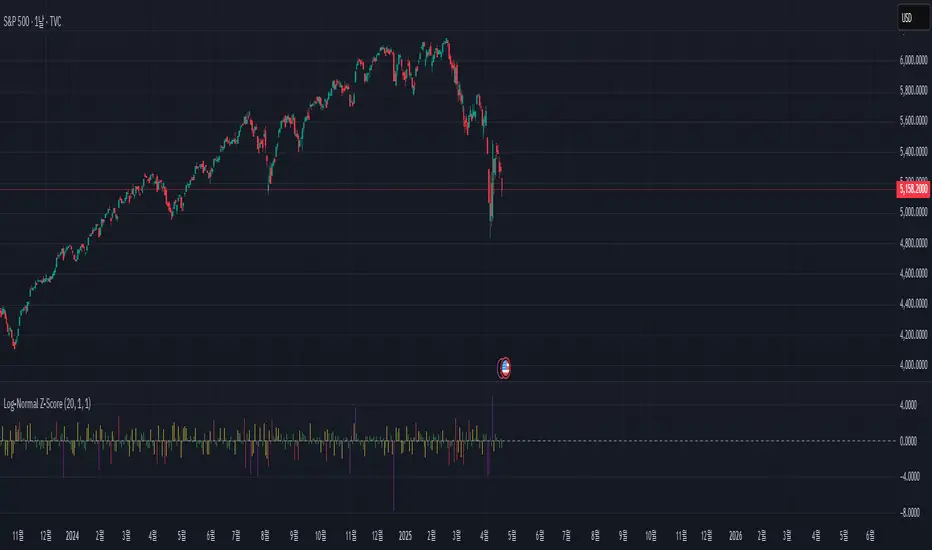
Log-Normal Z-ScoreLog-Normal Z-Score
This Pine Script indicator calculates a modified Z-Score based on log-normal returns, aiming to identify statistically significant price deviations.
Indicator Parameters:
Model Length: The number of bars used to calculate the mean and standard deviation of log returns.
Lookback Length: The number of bars used to compute the lookback return and volatility. This is the main timeframe over which the Z-Score is calculated.
Volatility SMA Length: The smoothing length for the volatility, applying a simple moving average to the calculated volatility.
TDO & Hit Rates by Weekday (5 min)Purpose
Tracks how often the next NY session “hits” the previous day’s True Day Open (TDO) level, separately for sessions that open above vs. below TDO, and breaks the statistics down by weekday (Mon–Fri) plus an overall summary.
Key Features
True Day Open (TDO) Plot
Captures the prior day’s 23:00 CT close price as the TDO.
Plots it as a continuous yellow line across your chart.
Session Labeling
At the end of each NY session (08:30–15:00 CT), places a small “TDO” label at the TDO price to confirm visually where it lay during that day.
Hit‑Count Logic
For each 5 min bar in the NY session, checks if the bar’s high ≥ TDO ≥ low (i.e. the TDO level was “hit”).
Classifies each session by whether its opening price (first 5 min bar) was above or below the TDO.
Weekday Statistics Table
Displays in the bottom‑left of your main chart window.
Rows: Header, Mon, Tue, Wed, Thu, Fri, All.
Columns:
% Hit Above: % of “above‑TDO” sessions that saw at least one hit
% Hit Below: % of “below‑TDO” sessions that saw at least one hit
Automatically updates in real time as new sessions complete.
Inputs & Settings
Data Resolution: Default = 5 min; use any intraday timeframe you like (1, 3, 15 min, etc.).
Extended Hours: Make sure your chart’s Extended Session (overnight) is enabled so the 23:00 CT bar exists.
Overlay: Draws directly on your price chart (no separate pane).
How to Use
Add to Chart: Paste the Pine v5 code into TradingView’s editor and apply to your ES (or other) futures chart.
Enable Overnight Bars: In Chart Settings → Symbol/Session → include Extended Hours.
Select Timeframe: Set the chart (or the indicator’s “Data Resolution” input) to 5 min (or your preferred intraday).
Read the Table:
Each weekday row shows how reliable TDO touches have been historically, separately for “above” and “below” opens.
The bottom “All” row summarizes combined performance.
What You Learn
Edge Analysis: Do sessions opening above TDO tend to test that level more often than those opening below (or vice versa)?
Day‑of‑Week Bias: Are certain weekdays more prone to TDO retests?
Overall Confidence: The “All” row lets you see your full-sample hit‑rate on both sides.

Log-Normal Price DistributionThis Pine Script indicator plots a log-normal distribution model of future price projections on a TradingView chart. It visualizes the potential price ranges based on the statistical properties (mean and standard deviation) of log returns over a defined period. It's particularly useful for analyzing potential volatility and predicting future price ranges.

MACD Bullish Cross Alert📘 Indicator Description – MACD Bullish Cross Alert
This indicator is designed to detect bullish momentum shifts using the classic MACD (Moving Average Convergence Divergence) crossover strategy.
Key Features:
Calculates the MACD Line and Signal Line using customizable inputs (default: 12, 26, 9).
Triggers an alert when the MACD Line (blue) crosses above the Signal Line (orange).
Helps identify early bullish trend reversals or momentum entry points.
Ideal for swing traders, position traders, and crypto investors using the weekly timeframe.
How to Use:
Add to any chart and set the timeframe to 1W (weekly).
Create an alert using the built-in MACD Bullish Crossover condition.
Combine with price action, volume, or RSI for higher conviction entries.
Use Cases:
Spotting early entry points after long downtrends.
Confirming a trend reversal in high timeframes.
Generating high-probability entries in trend-following systems.

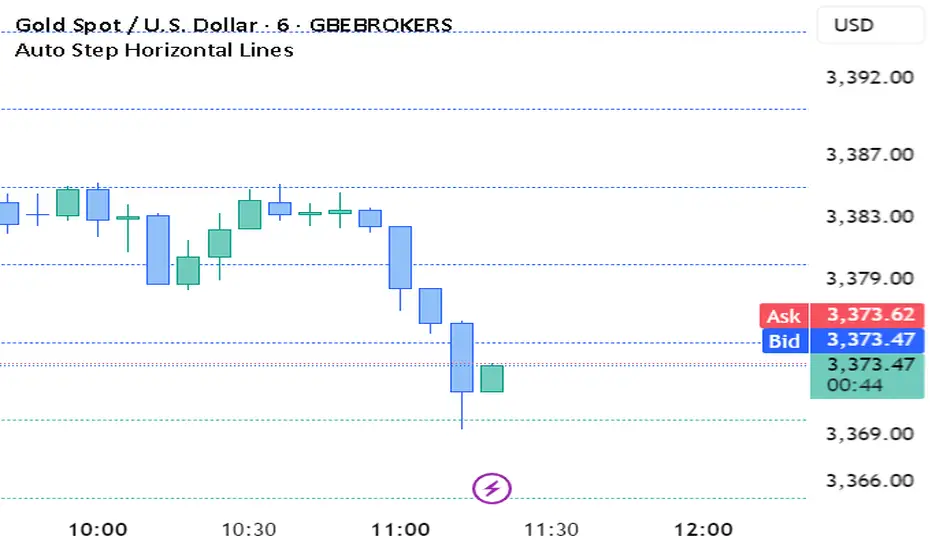
Auto Step Horizontal LinesAuto Step Horizontal lines by custom range
Create automatic horizontal lines by specifying the price range for each line, with each line serving as an observation point for support and resistance levels.
MG Universal model🚀 Summary🚀
The MG univerasal model is a composite of various items such as RSI, price Z-Score, Sharpe Ratio, Sortino Ratio, Omega Ratio, etc
Each component is normalized and then equally wheighted out to perform a global metric.
At the end, an Exponential Moving Average is added on the global metric.
You can easily find a description of each component on the internet, for the Crosby Ratio, it's a metric that comes from bitcoinmagazinepro.com.
✨ Key Features ✨
🗡 Smoothed Global Metric
Using a Moving average to smooth out the whole aggregated metric.
🗡 Bands Zone at extreme levels
Automatically displaying bands at top and bottom levels of the oscillator.
🗡 Normalizing components
Each component is normalized.
🗡 DataTable
Optional DataTable is available to check the score for each components and their related Z-Score.
📊 How I use it 📊
When catching up with 0 line (midline), crossing it :
if it goes above 0.2:
get out when it crosses 0.2 again
else:
get out when it crosses 0 again
That's the way I use it, may be there is a better way, FAFO :)
❓ Seeing a bug or an issue ❓
Feel free to DM me if you see a component that seems badly calculated.
I will be happy to fix it.
❗❗ Disclaimer ❗❗
This is a single indicator, even though it's aggregating many, do not use it as a standalone.
Past performance is not indicative of future results.
Always backtest, check, and align parameters before live trading.

CVD (Cumulative Volume Delta)
Cumulative Volume Delta
Use a moving average with three different
I thought about determining the volatility and direction of the price of the stock price and finding a place to break through.
I made some Mistake coz I'm new corder
I'm reposting this simple script due to house rule violation. (Whatever can haha) 😁
I'm erasing all the comments in my native language that I had in my script... I thought it would make the User uncomfortable, so I locked the code, and I thought maybe that's the problem
Anyway, I'm sorry 😅

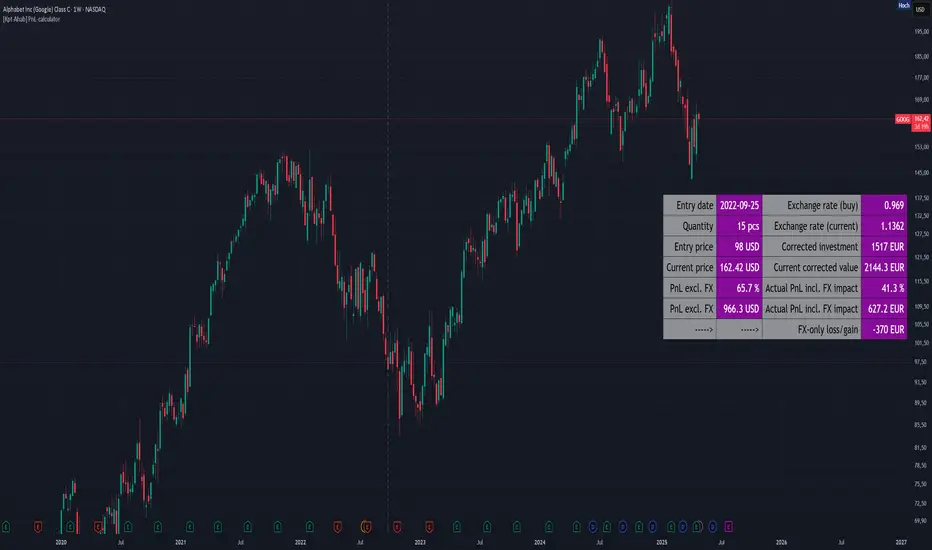
[Kpt-Ahab] PnL-calculatorThe PnL-Cal shows how much you’re up or down in your own currency, based on the current exchange rate.
Let’s say your home currency is EUR.
On October 10, 2022, you bought 10 Tesla stocks at $219 apiece.
Back then, with an exchange rate of 0.9701, you spent €2,257.40.
If you sold the 10 Tesla shares on April 17, 2025 for $241.37 each, that’s around a 10% gain in USD.
But if you converted the USD back to EUR on the same day at an exchange rate of 1.1398, you’d actually end up with an overall loss of about 6.2%.
Right now, only a single entry point is supported.
If you bought shares on different days with different exchange rates, you’ll unfortunately have to enter an average for now.
For viewing on a phone, the table can be simplified.
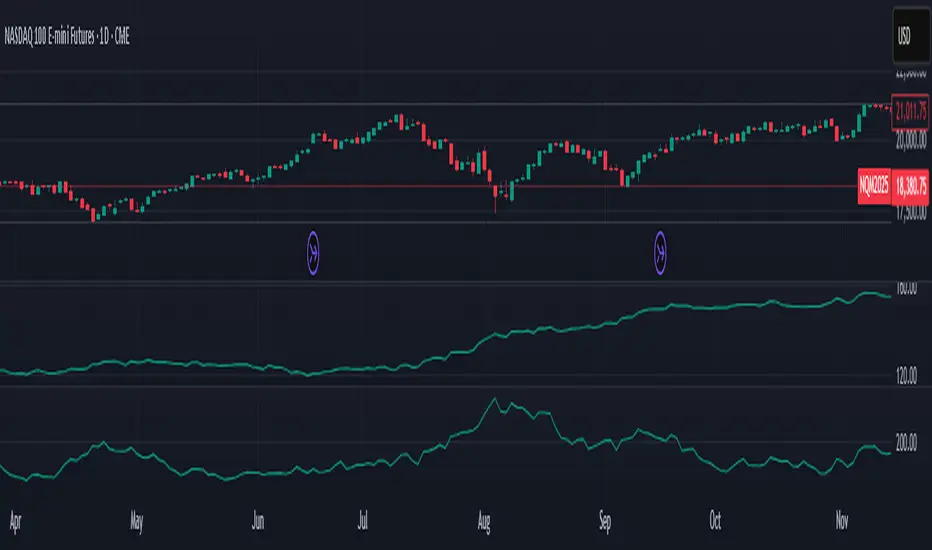
Institutional MACD (Z-Score Edition) [VolumeVigilante]📈 Institutional MACD (Z-Score Edition) — Professional-Grade Momentum Signal
This is not your average MACD .
The Institutional MACD (Z-Score Edition) is a statistically enhanced momentum tool, purpose-built for serious traders and breakout hunters . By applying Z-Score normalization to the classic MACD structure, this indicator uncovers statistically significant momentum shifts , enabling cleaner reads on price extremes, trend continuation, and potential reversals.
💡 Why It Matters
The classic MACD is powerful — but raw momentum values can be noisy and relative , especially on volatile assets like BTC/USD . By transforming the MACD line, signal line, and histogram into Z-scores , we anchor these signals in statistical context . This makes the Institutional MACD:
✔️ Timeframe-agnostic and asset-normalized
✔️ Ideal for spotting true breakouts , not false flags
✔️ A reliable tool for detecting momentum divergence and exhaustion
🧪 Key Features
✅ Full Z-Score normalization (MACD, Signal, Histogram)
✅ Highlighted ±Z threshold bands for overbought/oversold zones
✅ Customizable histogram coloring for visual momentum shifts
✅ Built-in alerts for zero-crosses and Z-threshold breaks
✅ Clean overlay with optional display toggles
🔁 Strategy Tip: Mean Reversion Signals with Statistical Confidence
This indicator isn't just for spotting breakouts — it also shines as a mean reversion tool , thanks to its Z-Score normalization .
When the Z-Score histogram crosses beyond ±2, it marks a statistically significant deviation from the mean — often signaling that momentum is overstretched and the asset may be due for a pullback or reversal .
📌 How to use it:
Z > +2 → Price action is in overbought territory. Watch for exhaustion or short setups.
Z < -2 → Momentum is deeply oversold. Look for reversal confirmation or long opportunities.
These zones often precede snap-back moves , especially in range-bound or corrective markets .
🎯 Combine Z-Score extremes with:
Candlestick confirmation
Support/resistance zones
Volume or price divergence
Other mean reversion tools (e.g., RSI, Bollinger Bands)
Unlike the raw MACD, this version delivers statistical thresholds , not guesswork — helping traders make decisions rooted in probability, not emotion.
📢 Trade Smart. Trade Vigilantly.
Published by VolumeVigilante

Vietnamese Stocks: Multi-Ticker Fibonacci AlertThis Pine Script™ indicator is designed specifically for traders monitoring the Vietnamese stock market (HOSE, HNX). Its primary goal is to automate the tracking of Fibonacci retracement levels across a large list of stocks, alerting you when prices breach key support zones.
Core Functionality:
The script calculates Fibonacci retracement levels (23.6%, 38.2%, 50%, 61.8%, 78.6%) for up to 40 tickers simultaneously. The calculation is based on the highest high and lowest low identified since a user-defined Start Time. This allows you to anchor the Fibonacci analysis to a specific market event, trend start, or time period relevant to your strategy.
What it Does For You:
Automated Watchlist Scanning: Instead of drawing Fib levels on dozens of charts, select one of the two pre-configured watchlists (up to 40 symbols each, customizable in settings) populated with popular Vietnamese stocks.
Time-Based Fibonacci: Define a Start Time in the settings. The script uses this date to find the subsequent highest high and lowest low for each symbol in your chosen watchlist, forming the basis for the Fib calculation.
Intelligent Alerts: Get notified via TradingView's alerts when the candle closing price of any stock in your active watchlist falls below the critical 38.2%, 50%, 61.8%, or 78.6% levels relative to its own high/low range since the start time. Alerts are consolidated for efficiency.
Visual Aids:
- Plots the same time-based Fibonacci levels directly on your current chart symbol for quick reference.
- Includes an optional on-chart table showing which monitored stocks are currently below key Fib levels (enable "Show Debug Info").
- Features experimental background coloring to highlight potential bullish signals on the current chart.
Configuration:
Start Time: Crucial input – sets the anchor point for Fib calculations.
WatchList Selection: Choose between WatchList #1 (Bluechip/Midcap focus) or WatchList #2 (Defensive/Other focus) using the boolean toggles.
Symbol Customization: Easily replace the default symbols with your preferred Vietnamese stocks directly in the indicator settings.
Notification Prefix: Add custom text to the beginning of your alert messages.
Alert Setup: Remember to create an alert in TradingView, selecting this indicator and the alert() condition, usually with "Once Per Bar Close" frequency.
This tool is open-source under the MPL 2.0 license. Feel free to use, modify, and learn from it.

Statistical Trailing Stop [LuxAlgo]The Statistical Trailing Stop tool offers traders a way to lock in profits in trending markets with four statistical levels based on the log-normal distribution of volatility.
The indicator also features a dashboard with statistics of all detected signals.
🔶 USAGE
The tool works out of the box, traders can adjust the data used with two parameters: data & distribution length.
By default, the tool takes volatility measures of groups of 10 candles, and statistical measures of the last 100 of these groups then traders can adjust the base level to use as trailing, the larger the level, the more resistant the tool will be to moves against the trend.
🔹 Base Levels
Traders can choose up to 4 different levels of trailing, all based on the statistical distribution of volatility.
As we can see in the chart above, each higher level is more resistant to market movements, so level 0 is the most reactive and level 3 the least.
It is up to the trader to determine the best level for each underlying, time frame and market conditions.
🔹 Dashboard
The tool provides a dashboard with the statistics of all trades, making it very easy to assess the performance of the parameters used for any given market.
As we can see on the chart, all Daily BTC signals with default parameters but different base levels, level 2 is the best performing of all four, giving a positive expectation of $2435 per trade, taking into account all long and short trades.
Of note are the long trades with a win rate of 76.47% and a risk-to-reward of 3.34, giving a positive expectation of $4839 per trade, with winners having an average duration of 210 days and losers 32 days.
This, compared to short trades with negative expectation, speaks to the uptrend bias of this particular market.
🔶 SETTINGS
Data Length: Select how many bars to use per data point
Distribution Length: Select how many data points the distribution will have
Base Level: Choose between 4 different trailing levels
🔹 Dashboard
Show Statistics: Enable/disable dashboard
Position: Select dashboard position
Size: Select dashboard size

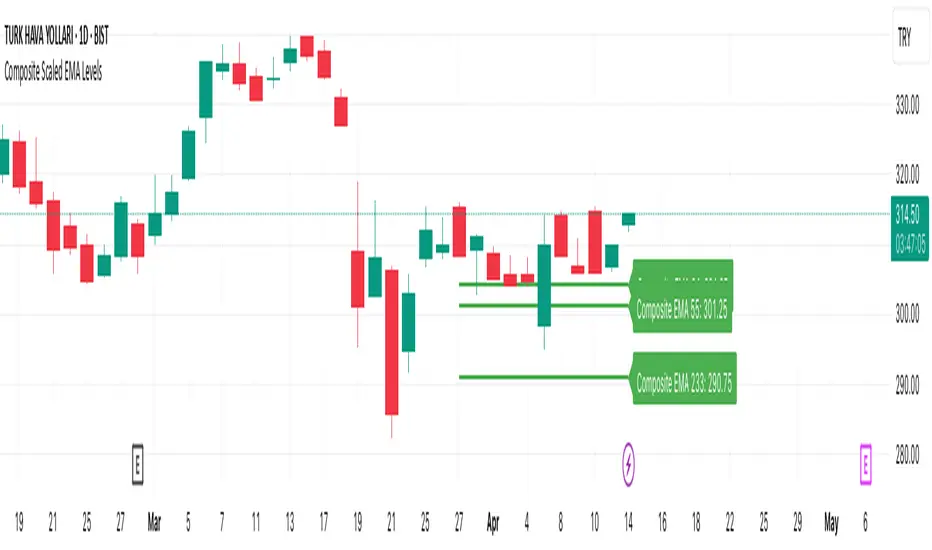
Composite Scaled EMA LevelsComposite Scaled EMA Levels Indicator
This TradingView Pine Script indicator calculates a “composite EMA” that compares the closing price of the current asset with that of the XU100 index and scales the EMA values to the XU100 level. It then visualizes these computed levels as horizontal lines on the chart with corresponding labels.
Key Components:
Inputs and Data Retrieval:
Length Input: The user defines a parameter length (default is 10) which determines over how many bars the horizontal line is drawn.
Data Collection:
The daily closing price of the current symbol (current_close) is retrieved using request.security().
The daily closing price of the XU100 index (xu100) is also retrieved.
A ratio is computed as current_close / xu100. This ratio serves as the basis for calculating the composite EMAs.
EMA Calculations:
The indicator computes Exponential Moving Averages (EMAs) on the ratio for specific periods.
In the provided version, the script calculates EMAs for three periods (34, 55, and 233), though you can easily expand this to other periods if needed.
Each computed EMA (for instance, EMA34, EMA55, EMA233) is then scaled by multiplying it with the XU100 index’s close, converting it to a price level that is meaningful on the chart.
Drawing Horizontal Lines:
Instead of using the standard plot() function, the script uses line.new() to draw horizontal lines representing the scaled EMA values over the last “length” bars.
Before drawing new lines, any existing lines and labels are deleted to ensure that only the most current values are shown.
Adding Labels to Lines:
The script creates a label for each EMA using label.new(), placing the label at the current bar (i.e., the rightmost position on the chart) using label.style_label_left so that the text appears to the right of the line.
The label displays the name of the composite EMA (e.g., "Composite EMA 34") along with its current scaled value.
Visualization:
The horizontal lines and labels provide a visual reference for the composite EMA levels. These lines help traders see critical support/resistance levels derived from the relationship between the current asset and the XU100 index.
Colors are assigned for clarity (for example, the EMA lines in this version use green).
Summary:
The Composite Scaled EMA Levels indicator is designed to help traders analyze the relationship between an asset’s price and the broader market index (XU100) by calculating a ratio and then applying EMAs on that ratio. By scaling these EMAs back to price levels and displaying them as horizontal lines with clear labels on the chart, the indicator offers a visual tool to assess trend direction and potential support or resistance levels. This can assist in making informed trading decisions based on composite trend analysis.
Average Body RangeThe Average Body Range (ABR) indicator calculates the average size of a candle's real body over a specified period. Unlike the traditional Average Daily Range (ADR), which measures the full range from high to low, the ABR focuses solely on the absolute difference between the open and close of each bar. This provides insight into market momentum and trading activity by reflecting how much price is actually moving from open to close , not just in total.
This indicator is especially useful for identifying:
Periods of strong directional movement (larger body sizes)
Low-volatility or indecisive markets (smaller body sizes)
Changes in trend conviction or momentum
Customization:
Length: Number of bars used to compute the average (default: 14)
Use ABR to enhance your understanding of price behavior and better time entries or exits based on market strength.
RTH and ETH RangesKey Functions :
Visualizes Regular Trading Hours (RTH) and Extended Trading Hours (ETH) price ranges
Tracks session highs, lows, and 50% levels where significant market reactions occur
Detects breakouts beyond previous session extremes
Trading Applications :
Exposes potential liquidity raids at session boundaries where smart money targets stop orders
Identifies critical price thresholds where institutional activity concentrates
Highlights divergences between RTH and ETH behavior that precede directional moves
Provides measurement of session volatility differences
Maps key price levels for objective entry and exit parameters
Reveals market dynamics at session transitions where institutional positioning changes

Dirty Market IndexThis indicator is designed to out an index displaying the level of dirtiness in market.
This level is defined by:
Sum of shadow lengths of last n candles (n is input and user can change it, it's 100 by default)
divided by
Sum of full candle bodies of last n candles (high - low)
This factor indicates how many percents of the market movement has been placed in shadows of candles, the higher this number, the dirtier market would be.

3 Candles Gap3 Candle Gap Indicator is made to detect these types of patterns:
1. 3 consecutive bullish or bearish candles
2. the middle candle true body (body excluding shadows) has a part that is not covered by previous and next candle shadows (gap)
This pattern helps traders to detect candles where price has moved in a direction and gap has formed (price is not covered by previous or next candles shadows), this is a signal showing price momentum where one side (bulls/bears) is so powerful at moving the price that the other side (bears/bulls) can't get price back to cover the gap.
This indicator has "repainting" by 1 candle which means, it uses the data from future to work, however this future data does not go further than 1 candle.