Orderblock Footprints [AlgoAlpha]🟠 OVERVIEW
This script highlights orderblocks and then drills into what actually trades inside them. Zones are created only after an abnormal directional impulse, measured with a z-score on consecutive candle bodies, so the orderblocks are tied to real expansion rather than simple pivots. Once a zone exists, the script overlays lower-timeframe volume footprints inside the candle when price trades back into that zone. The goal is to show not just where an orderblock sits, but whether price is being accepted or absorbed when it is revisited.
🟠 CONCEPTS
Orderblocks are detected after extreme bullish or bearish impulses. The script tracks consecutive body movement up or down, normalizes that distance with a rolling z-score, and only triggers when the move is statistically large. The last opposite candle before that impulse defines the orderblock range. These zones then extend forward until they are either mitigated by price closing through them or they expire by age.
Inside an active zone, the script switches to a lower timeframe and builds a footprint-style profile for each bar. Each candle is split into price rows, counting time-at-price and volume delta. Positive and negative delta are colored separately. Absorption is flagged when opposing delta prints appear in the wick that rejects the zone. In practice: the impulse defines context ; the footprint shows interaction .
🟠 FEATURES
Separate bullish and bearish zones with automatic extension
Volume split inside each zone candle (up vs down volume)
Lower-timeframe footprint with TPO-style rows and delta gradient
Absorption detection using opposing delta in rejection wicks
Alerts for zone creation and absorption events
🟠 USAGE
Setup : Add the script to your chart. It works on any market and timeframe. The lower timeframe for footprints is fixed at 5 minutes, so higher chart timeframes show clearer structure. Use the Z-Score Window to control how strict impulse detection is and Max Box Age to limit how long old zones stay on the chart.
Read the chart : Bullish orderblocks are created after strong upward impulses and are invalidated when price closes below them. Bearish orderblocks are created after strong downward impulses and are invalidated when price closes above them. When price trades inside a zone, footprint rows appear. Green-tinted rows show positive delta; red-tinted rows show negative delta. Absorption labels appear when opposing delta prints into a rejecting wick.
Settings that matter : Increasing the Z-Score Window makes orderblocks rarer but more significant. Disabling Prevent Overlap allows stacked zones if you want to study clustering. Adjusting Rows per bar changes footprint resolution—lower values are cleaner, higher values show more detail but use more objects.
Smartmoneyconcept

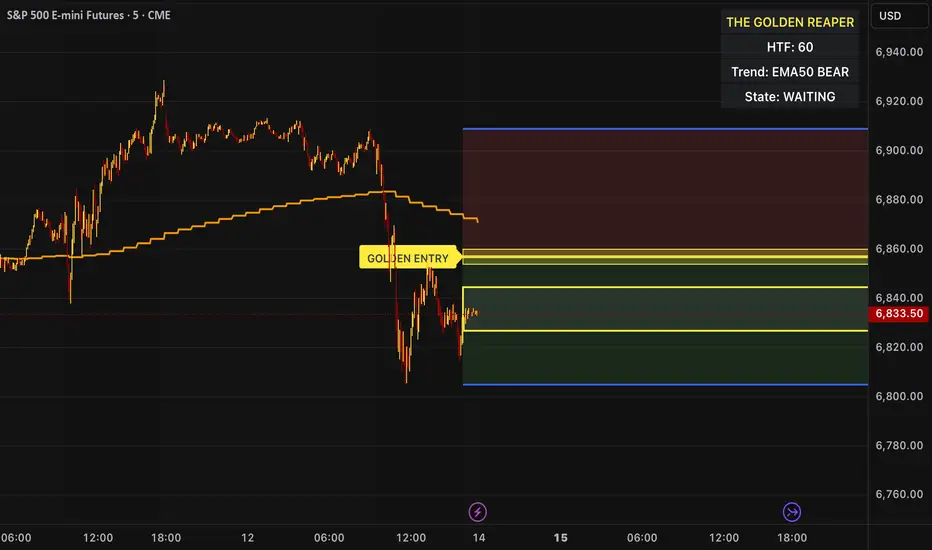
The Golden Reaper 🟡 THE GOLDEN REAPER
HTF OTE + EMA50 — Futures Scalping Framework
The Golden Reaper is a high-timeframe execution framework designed specifically for futures scalpers who trade with precision, patience, and structure.
This indicator focuses on HTF market structure, Optimal Trade Entry (OTE) zones, and equilibrium (50%) reclaim confirmation to identify high-probability execution areas for fast, controlled scalps.
It is not a signal spam tool.
It is a framework built for disciplined traders who wait for price to come to them.
⸻
🔑 Designed For
✔ Futures markets (ES, NQ, MNQ, MES, GC, MGC, CL, etc.)
✔ Scalpers & intraday traders
✔ 1H structure → 5m / 1m execution
✔ Traders who prefer few high-quality setups
⸻
🧠 Core Logic (How It Works)
1️⃣ High-Timeframe Structure (HTF)
The indicator identifies the most recent HTF swing high and low to define the active trading leg.
2️⃣ OTE Zone (Premium / Discount)
Price is expected to react within the OTE zone where liquidity is commonly targeted.
3️⃣ Golden Entry (EQ 50%)
The 50% equilibrium level is marked as the Golden Entry.
Price must reclaim this level for a setup to become valid.
4️⃣ Golden Execution Zone
After reclaim, a golden execution zone appears to define where entries are allowed.
5️⃣ EMA 50 Trend Filter
Trades are taken only in the direction of the HTF EMA 50 to avoid counter-trend scalps.
⸻
⚡ How Futures Scalpers Use It
Recommended Timeframes
• HTF Structure: 1 Hour
• Execution: 5 Minute / 1 Minute
Process
• Wait for price to reach the OTE zone
• Allow the setup to arm
• Enter only after price reclaims the Golden Entry
• Execute within the Golden Execution Zone
• Manage stops and targets manually
This approach helps scalpers:
✔ Avoid chasing price
✔ Reduce over-trading
✔ Improve entry precision
✔ Maintain consistency
⸻
🔔 Alerts Included
• OTE Touched – Setup is armed
• C-Reclaim Confirmed – Entry condition met
(Alerts are designed to assist — not replace — trader judgment.)
⸻
⚠️ Important Notes
• Designed for futures markets only
• Best used with price action confirmation
• No built-in stop loss or take profit (manual risk management required)
• Not financial advice
⸻
🧬 Who This Indicator Is For
✔ Futures scalpers
✔ ICT / Smart Money traders
✔ Structure-based traders
✔ Traders who value patience over frequency
❌ Not for:
• Signal chasers
• Indicator stacking
• Automated trading
• Beginners who want instant entries
⸻
🟡 Created By
ChartReaper / Tactiko
Instagram:
@officialchartreaper
@tactiko
Smart Money Liquidity Structure AlgoSmart Money Liquidity Structure Algo is a rule-based trading strategy designed to analyze market structure, liquidity zones, and volatility conditions.
The script combines structure breakout logic, volatility filtering, order-block style price gaps, and Supertrend direction to generate systematic long and short signals.
This strategy is intended for educational and research purposes, helping traders study how liquidity, structure, and trend alignment can be combined into a single framework.
All signals are generated objectively using predefined conditions without repainting after bar close.
The strategy includes built-in risk management logic using ATR-based stop-loss and trailing exit mechanisms.
⚙️ Core Logic Overview
Market structure based on pivot-derived support and resistance
Volatility normalization filter to avoid low-activity periods
Price gap detection inspired by order-block concepts
Supertrend-based directional confirmation
Time-based holding logic before exits are allowed
✨ Features
Rule-based long and short entries
Liquidity & structure breakout detection
Volatility-filtered signal generation
Optional Supertrend trend filter
ATR-based stop-loss and trailing exits
Non-repainting logic after candle close
🧪 How to Use
Apply on liquid markets such as crypto, indices, or forex
Works best on intraday to higher timeframes
Adjust volatility filter and ATR multiplier based on the instrument
Always forward-test and paper-trade before live use
⚠️ Disclaimer
This script is not financial advice.
Trading involves risk, and past performance does not guarantee future results.
Use this strategy for analysis, testing, and educational purposes only.

KIMATIX Silver Bullet 2.0KIMATIX Silver Bullet 2.0 is a precision-based intraday trading tool built around the most reliable market behaviors during the ICT Silver Bullet windows.
The indicator automatically identifies high-probability price delivery zones by combining time-based session logic, displacement, fair value gaps, and liquidity dynamics — without clutter or subjective interpretation.
What the indicator does
Automatically marks the three core Silver Bullet windows (New York time)
Tracks session highs and lows to define contextual liquidity
Detects displacement moves using adaptive volatility logic
Highlights valid Silver Bullet Fair Value Gaps (FVGs) only when structural conditions are met
Filters weak setups by minimum size, age, and directional confirmation
Projects FVG zones forward to monitor clean retracements
Plots liquidity levels (highs & lows) with optional mitigation handling
All calculations are done fully automatically — no manual drawing, no guessing.
Designed for
Scalper and Intraday traders (especially 1–5 minute charts)
Futures, indices, forex, and crypto
Traders who want clear execution zones, not lagging signals
Anyone using liquidity-based or ICT-style frameworks
Key advantages
No signals, no repainting logic — context first
Strict filtering to reduce noise and over-marking
Clean visual layout focused on price delivery
Works seamlessly alongside higher-timeframe bias and volume tools
This indicator does not tell you when to trade —
it shows you where the market is most likely to react.
Important note
KIMATIX Silver Bullet 2.0 is a context and execution tool, not a standalone strategy.
Best results are achieved when combined with proper risk management and directional bias.
More Infos and Premium Indicators: kimatixtrading.com

SMC-Math by Thomas v1📌 SMC-Math by Thomas v1 — Description
SMC-Math by Thomas v1 is a complete Smart Money Concepts toolkit designed for traders who want a clean, mathematical, and structured view of market mechanics.
Rather than relying on abstract concepts or subjective drawings, this indicator focuses on rules-based detection of:
✔ Order Blocks (OB)
✔ Fair Value Gaps (FVG)
✔ Market Structure shifts (BoS / CHoCH)
✔ HTF trend confirmation
✔ Premium / Discount arrays
✔ Equal High & Equal Low Liquidity Zones (no hinting — expiry only)
This version is engineered for stability, clarity, and performance — with fully optimized array management, timestamp-based cleanup, and a clean visual presentation suitable for both discretionary and systematic trading.
📌 Key Features
🔹 1. Order Blocks (Bullish & Bearish)
Auto-detected using fractal swing highs/lows
Optional displacement + high volume filters
Midline display option
HTF trend alignment filter
Smart expiry + broken OB cleanup
Custom opacity, buffer, and extension controls
🔹 2. Fair Value Gaps (FVG)
Bullish and bearish gap detection
HTF confirmation-based dimming
No border for a clean ICT-style visuals
Auto remove when filled
Fully rule-based
🔹 3. Market Structure (BoS / CHoCH)
Based on fractal highs/lows
Automatic labeling (small, unobtrusive)
Direction validated by HTF option
Each structure level plotted with a projected line
Smooth, clean BOS/CHOCH flow
🔹 4. Premium / Discount Zones
Auto-calculated from most recent swing high & swing low
Box shading dynamically updates each bar
Helps identify optimal trade areas (OB → FVG → PD array)
🔹 5. Liquidity Zones (Equal Highs & Equal Lows)
This tool highlights where liquidity is likely resting:
Detects Equal Highs and Equal Lows using your tolerance or max difference
Auto-creates borderless shaded boxes
Adjustable box height and extension
NO hinting logic — the box remains for exactly cleanupDelay bars, then expires
Clean and predictable behavior, ideal for rule-based setups
This is especially useful for:
identifying buy-side and sell-side liquidity pools
anticipating runs on liquidity
targeting sweeps
🔹 6. HTF Status Panel
Shows higher-timeframe trend status on the live bar:
Bullish
Bearish
Or “HTF Not Required”
Useful for aligning entries with larger market flow.
📌 How to Use SMC-Math by Thomas v1
1️⃣ Identifying Direction
Start by reading:
HTF Trend Label
BOS & CHOCH reactions
Bullish: look for HL → HH structure + bullish OBs + bullish FVGs
Bearish: look for LH → LL structure + bearish OBs + bearish FVGs
This creates your directional bias.
2️⃣ Using Order Blocks
An OB is valid when:
It appears in line with structure
HTF alignment supports it (optional toggle)
Price returns after a displacement
OB is not “broken” (indicator handles this visually)
Use OBs as:
Rebalance targets
Entry areas
Stop placement logic
3️⃣ Fair Value Gaps
FVGs appear when price dislocates and leaves inefficiency.
Use them to:
Refine entries inside OBs
Project premium/discount zones
Identify continuation zones
The indicator auto-removes FVGs when filled.
4️⃣ Liquidity Zones
Liquidity zones identify resting orders at equal highs/lows.
This version uses simple expiry logic:
Box is created when EQH/EQL forms
It remains visible for 20 bars (default)
It disappears automatically after expiry
No hint/confirmation triggers deletion
Usage tips:
Expect price to run toward these zones
Use them as targets or continuation markers
Combine with OB/FVG for confluence
5️⃣ Premium / Discount Zones
Use PD arrays to gauge:
Premium = optimal shorting zones
Discount = optimal long zones
Not trade “in the middle” unless a clear BOS or CHoCH happens
📌 Recommended Workflow
HTF Bias → Check the HTF panel
Market Structure → Identify trend continuation or reversal
Liquidity → Mark where price is likely to target
FVG → Identify imbalance zones
OB → Confirm institutional origin points
PD Arrays → Determine optimal trade location
Execute with confluence
📌 Who Is This Indicator For?
✔ Traders using ICT / SMC logic
✔ Traders wanting rule-based, non-subjective markups
✔ Traders who want automated detection without repainting
✔ Anyone who uses OB, FVG, liquidity sweeps, and structure shifts

Smart Money Concepts [MHA Finverse]A comprehensive Smart Money Concepts (SMC) indicator designed to identify institutional trading behavior and market structure shifts. This tool helps traders align with "smart money" by detecting key supply and demand zones, structural breaks, and liquidity patterns.
Core Features
Market Structure Analysis
- Real-time Internal Structure: Detects short-term BOS (Break of Structure) and CHoCH (Change of Character) with customizable filters
- Swing Structure: Identifies major trend shifts and structural breaks on higher timeframes
- Adjustable pivot detection with customizable swing point visualization
- Strong/Weak High/Low identification for bias confirmation
Order Blocks (OB)
- Internal and Swing Order Blocks with independent control
- Volume-based metrics showing OB strength and percentage contribution
- Two filtering methods: ATR-based and Cumulative Mean Range
- Flexible mitigation options (Close or High/Low)
- Display up to 20 order blocks per type with auto-cleanup on mitigation
- Color-coded zones with transparency control
Liquidity Detection
- Equal Highs (EQH) and Equal Lows (EQL) identification
- Threshold-based detection using ATR calculation
- Visual confirmation lines connecting equal levels
- Adjustable sensitivity and bar confirmation settings
Fair Value Gaps (FVG)
- Multi-timeframe FVG detection
- Auto-threshold calculation based on price momentum
- Bullish and Bearish gap visualization
- Extendable gap boxes for tracking unfilled imbalances
Premium & Discount Zones
- Automated premium, equilibrium, and discount zone plotting
- Based on current swing range extremes
- Visual representation of optimal entry zones
- Helps identify potential reversal and continuation areas
Multi-Timeframe Levels
- Previous Daily, Weekly, and Monthly High/Low levels
- Customizable line styles (solid, dashed, dotted)
- Independent color controls for each timeframe
- Auto-adjusted labels (PDH, PDL, PWH, PWL, PMH, PML)
Display Modes
- Historical Mode: Shows all past structures and maintains drawing history
- Present Mode: Displays only current active structures for cleaner charts
Visual Themes
- Colored: Full color customization for all elements
- Monochrome: Clean grey-scale design for minimal distraction
Smart Features
- Confluence filter for internal structure to reduce noise
- Automatic candle coloring based on market bias
- 16 pre-configured alert conditions for all major signals
- Efficient rendering with automatic cleanup of broken structures
- Independent control over each feature for modular usage
Use Cases
- Identify institutional entry and exit points through order blocks
- Spot potential reversals at premium/discount zones
- Confirm trend direction with BOS and CHoCH signals
- Find liquidity grabs at equal highs and lows
- Trade imbalances at fair value gaps
- Align entries with multi-timeframe key levels
Settings Organization
All features are neatly organized into logical groups:
- Smart Money Concepts (general settings)
- Real Time Internal Structure
- Real Time Swing Structure
- Order Blocks
- EQH/EQL
- Fair Value Gaps
- Highs & Lows MTF
- Premium & Discount Zones
Note: This indicator works on all timeframes and instruments. For optimal results, combine multiple SMC concepts together to find high-probability setups with confluence.
Credits
Special thanks to Dau_tu_hieu_goc and BigBeluga for their code examples and inspiration that contributed to the development of this indicator.
Disclaimer
This indicator is for educational purposes only and does not constitute financial advice. Trading involves substantial risk of loss. Past performance does not guarantee future results. Always use proper risk management and conduct your own analysis before making trading decisions. The developer is not responsible for any trading losses incurred.
Happy Trading

SMC Pro: Real-Time Final**Description:**
This comprehensive SMC indicator is designed to automatically visualize major **Trading Sessions** and **Killzones**, alongside Fair Value Gaps (FVG). It helps traders identify high-probability setups by correlating time and price, specifically during key market hours (London, New York, Asia).
**Key Features:**
1. **Trading Sessions & Killzones:** The indicator clearly highlights the open and duration of major sessions (Asia, London, New York), allowing traders to spot volatility injections and "Judas Swings."
2. **Automated FVG Detection:** Scans price action to locate valid Fair Value Gaps and Imbalances within these sessions.
3. **Entry Logic:** Marks potential entry zones at the 50% retracement level of the identified FVG.
4. **Risk Management:** Projects a fixed Risk-to-Reward ratio (e.g., 1:3) with automatic Stop Loss and Take Profit levels.
5. **Clean Visualization:** Color-coded boxes for sessions and gaps keep the chart organized.
**How to Use:**
* **Time Analysis:** Watch for price action as the London or NY session opens (highlighted by the indicator).
* **Signal:** Wait for an Imbalance/FVG to form during these high-volume times.
* **Entry:** Set a limit order at the 50% mark of the gap.
* **Exit:** Use the projected TP levels.
**Disclaimer:**
This tool is for educational purposes and technical analysis assistance only. Past performance does not guarantee future results.

SMC + OB + FVG + Reversal + UT Bot + Hull Suite – by Fatich.id🎯 7 INTEGRATED SYSTEMS:
✓ Mxwll Suite (SMC + Auto Fibs + CHoCH/BOS)
✓ UT Bot (Trend Signals + Label Management)
✓ Hull Suite (Momentum Analysis)
✓ LuxAlgo FVG (Fair Value Gaps)
✓ LuxAlgo Order Blocks (Volume Pivots) ⭐ NEW
✓ Three Bar Reversal (Pattern Recognition)
✓ Reversal Signals (Momentum Count Style)
⚡ KEY FEATURES:
• Smart Money Structure (CHoCH/BOS/I-CHoCH/I-BoS)
• Auto Fibonacci (10 customizable levels)
• Order Block Detection (Auto mitigation)
• Fair Value Gap Tracking
• Session Highlights (NY/London/Asia)
• Volume Activity Dashboard
• Multi-Timeframe Support
• Clean Label Management
🎨 PERFECT FOR:
• Smart Money Concept Traders
• Order Flow & Liquidity Analysis
• Support/Resistance Trading
• Trend Following & Reversals
• Multi-Timeframe Analysis
💡 RECOMMENDED SETTINGS:
Clean Charts: OB Count 3, UT Signals 3, FVG 5
Detailed Analysis: OB Count 5-10, All Signals
Scalping: Low sensitivity, Hull 20-30
Swing Trading: High sensitivity, Hull 55-100

RSI Analytic Volume Matrix [RAVM] Overview
RSI Analytic Volume Matrix is an overlay indicator that turns classic RSI into a multi-layered market-reading engine. Instead of treating RSI 30 and 70 as simple buy/sell lines, RAVM combines RSI geometry (angle and acceleration), statistical volume analysis, and a 5×5 VSA-inspired matrix to describe what is really happening inside each candle.
The script is designed as an educational and analytical tool. It does not generate trading signals. Instead, it helps you read the market context, understand where the pressure is coming from (buyers vs. sellers), and see how price, momentum, and volume interact in real time.
Concept & Philosophy
RAVM is built around a hierarchical logic and a few core ideas:
• Hierarchical State Machine: First, RSI defines a context (where we are in the 0–100 range). Then the geometric engine evaluates the angle-of-turn of RSI using a Z-Score. Only after a meaningful geometric event is detected does the system promote a bar to a potential setup (warning vs. confirmed).
• Geometric Primacy: The angle and acceleration of RSI (RSI geometry) are more important than the raw RSI level itself. RAVM uses a geometric veto: if the geometric trigger is not confirmed, the confidence score is capped below 50%, even if volume looks interesting.
• RSI Beyond 30 and 70: Being above 70 or below 30 is not treated as an automatic overbought/oversold signal. RAVM treats those zones as contextual factors that contribute only a partial portion of the final score, alongside geometry, total volume expansion, buy/sell balance, and delta power.
• Volume Decomposition: Volume is decomposed into total, buy-side, sell-side, and delta components. Each of these is normalized with a Z-Score over a shared statistical window, so RSI geometry and volume live in the same statistical context.
• Educational Scoring Pipeline: RAVM builds a 0–100 "Quantum Score" for each detected setup. The score expresses how strong the story is across four dimensions: geometry (RSI angle-of-turn), total volume expansion, which side is driving that volume (buyers vs. sellers), and the power of delta. The score is designed for learning and weighting, not for mechanical trade entries.
• VSA Matrix Engine: A 5×5 matrix combines momentum states and volume dynamics. Each cell corresponds to an interpreted VSA-style scenario (Absorption, Distribution, No Demand, Stopping Volume, Strong Reversal, etc.), shown both as text and as a heatmap dashboard on the chart.
How RAVM Works
1. RSI Context & Geometry
RAVM starts with a classic RSI, but it does not stop at simple level checks. It computes the velocity and acceleration of RSI and normalizes them via a Z-Score to produce an Angle-of-Turn metric (Z-AoT). This Z-AoT is then mapped into a 0–1 intensity value called MSI (Momentum Shift Intensity).
The script monitors both classic RSI zones (around 30 and 70) and geometric triggers. Entering the lower or upper zone is treated as a contextual event only. A setup becomes "confirmed" when a significant geometric turn is detected (based on Z-AoT thresholds). Otherwise, the bar is at most a warning.
2. Volume & Statistical Engine
The volume engine can work in two modes: a geometric approximation (based on candle structure) or a more precise intrabar mode using up/down volume requests. In both cases, RAVM builds a volume packet consisting of:
• Total volume
• Buy-side volume
• Sell-side volume
• Delta (buy – sell)
Each of these series is normalized using a Z-Score over the same statistical window that is used for RSI geometry. This allows RAVM to answer questions such as: Is total volume exceptional on this bar? Is the expansion mostly coming from buyers or from sellers? Is delta unusually strong or weak compared to recent history?
3. Scoring System (Quantum Score)
For each bar where a setup is active, RAVM computes a 0–100 score intended as an educational confidence measure. The scoring pipeline follows this sequence:
A. RSI Geometry (MSI): Measures the strength of the RSI angle-of-turn via Z-AoT. This has geometric primacy over simple level checks.
B. RSI Zone Context: Being below 30 or above 70 contributes only a partial bonus to the score, reflecting the idea that these zones are context, not automatic signals. Mildly supportive zones (e.g., RSI below 50 for bullish contexts) can also contribute with lower weight.
C. Total Volume Expansion: A normalized Volume Power term expresses how exceptional the total volume is relative to its recent distribution. If there is no meaningful volume expansion, the score remains modest even if RSI geometry looks interesting.
D. Which Side Is Driving the Volume: RAVM then checks whether the expansion is primarily on the buy side or the sell side, using Z-Score statistics for buy and sell volume separately. This stage does not yet rely on delta as a power metric; it simply answers the question: "Is this expansion mostly driven by buyers, sellers, or both?"
E. Delta as Final Power: Only at the final stage does the script bring in delta and its Z-Score as a measure of how one-sided the pressure really is. A strong negative delta during a bullish context, for example, can highlight absorption, while a strong positive delta against a bearish context can highlight distribution or a buying climax.
If a setup is not geometrically confirmed (for example, a simple entry into RSI 30/70 without a strong geometric turn), RAVM caps the final score below 50%. This "Geometric Veto" enforces the idea that RSI geometry must confirm before a scenario can be considered high-confidence.
4. Overlay UI & Smart Labels
RAVM is an overlay indicator: all information is drawn directly on the price chart, not in a separate pane. When a setup is active, a smart label is attached to the bar, together with a vertical connector line. Each label shows:
• Direction of the setup (bullish or bearish)
• Trigger type (classic OS/OB vs. geometric/hidden)
• Status (warning vs. confirmed)
• Quantum Score as a percentage
Confirmed setups use stronger colors and solid connectors, while warnings use softer colors and dotted connectors. The script also manages label placement to avoid overlap, keeping the chart clean and readable.
In addition to labels, a dashboard table is drawn on the chart. It displays the currently active matrix scenario, the dominant bias, a short textual interpretation, the full 5×5 heatmap, and summary metrics such as RSI, MSI, and Volume Power.
RSI Is Not Just 30 and 70
One of the central design decisions in RAVM is to treat RSI 30 and 70 as context, not as fixed buy/sell buttons. Many traders mechanically assume that RSI below 30 means "buy" and RSI above 70 means "sell". RAVM explicitly rejects this simplification.
Instead, the script asks a series of deeper questions: How sharp is the angle-of-turn of RSI right now? Is total volume expanding or contracting? Is that expansion dominated by buyers or sellers? Is delta confirming the move, or is there a hidden absorption or distribution taking place?
In the scoring logic, being in a lower or upper RSI zone contributes only part of the final score. Geometry, volume expansion, the buy/sell split, and delta power all have to align before a high-confidence scenario emerges. This makes RAVM much closer to a structured market-reading tool than a classic overbought/oversold indicator.
Matrix User Manual – Reading the 5×5 Grid
The heart of RAVM is its 5×5 matrix, where the vertical axis represents momentum states (M1–M5) and the horizontal axis represents volume dynamics (V1–V5). Each cell in this grid corresponds to a VSA-style scenario. The dashboard highlights the currently active cell and prints a textual description so you can read the story at a glance.
1. Confirmation Scenarios
These scenarios occur when momentum direction and volume expansion are aligned:
• Bullish Confirmation / Strong Reversal: Momentum is shifting strongly upward (often from a depressed RSI context), and expanded volume is driven mainly by buyers. Often seen as a strong bullish reversal or continuation signal from a VSA perspective.
• Bearish Confirmation / Strong Drop: Momentum is turning decisively downward, and expanded volume is driven mainly by sellers. This maps to strong bearish continuation or sharp reversal patterns.
2. Absorption & Stopping Volume
• Absorption: Total volume expands, but the dominant flow is opposite to the recent price move or the geometric bias. For example, heavy selling volume while the geometric context is bullish. This can indicate smart money quietly absorbing orders from the crowd.
• Stopping Volume: Exceptionally high volume appears near the end of an extended move, while momentum begins to decelerate. Price may still print new extremes, but the effort vs. result relationship signals potential exhaustion and the possibility of a turn.
3. Distribution & Buying Climax
• Distribution: Heavy buying volume appears within a bearish or topping context. Rather than healthy accumulation, this often represents larger players offloading inventory to late buyers. The matrix will typically flag this as a bearish-leaning scenario despite strong upside prints.
• Buying Climax: A surge of buy-side volume near the end of a strong uptrend, with momentum starting to weaken. From a VSA point of view, this is often the last push where retail aggressively buys what smart money is selling.
4. No Demand & No Supply
• No Demand: Price attempts to rise but does so on low, non-expansive volume. The market is not interested in following the move, and the lack of participation often precedes weakness or sideways action.
• No Supply: Price tries to push lower on thin volume. Selling pressure is limited, and the lack of supply can precede stabilization or recovery if buyers step back in.
5. Trend Exhaustion
• Uptrend Exhaustion: Momentum remains nominally bullish, but the quality of volume deteriorates (e.g., more effort, less net result). The matrix marks this as an uptrend losing internal strength, often after a series of aggressive moves.
• Downtrend Exhaustion: Similar logic in the opposite direction: strong prior downtrend, but increasingly inefficient downside progress relative to the volume invested. This can precede accumulation or a relief rally.
6. Effort vs. Result Scenarios
• Bullish Effort, Little Result: Buyers invest notable volume, but price progress is limited. This may reveal hidden selling into strength or a lack of follow-through from the broader market.
• Bearish Effort, Little Result: Sellers push volume, but price does not decline proportionally. This can indicate absorption of selling pressure and potential underlying demand.
7. Neutral, Churn & Thin Markets
• Neutral / Thin Market: Momentum and volume both remain muted. RAVM marks these as neutral cells where aggressive decision-making is usually less attractive and observing the broader structure is more important.
• High Volume Churn / Volatility: Both sides are active with high volume but limited directional progress. This can correspond to battle zones, local ranges, or high volatility rotations where the main message is conflict rather than clear trend.
Inputs & Options
RAVM includes several input groups to adapt the tool to your preferences:
• Localization: Multiple language options for all labels and dashboard text (e.g., English, Farsi, Turkish, Russian).
• RSI Core Settings: RSI length, source, and upper/lower contextual zones (typically around 30 and 70).
• Geometric Engine: Z-AoT sigma thresholds, confirmation ratios, and normalization window multiplier. These control how sensitive the script is to RSI angle-of-turn events.
• Volume Engine: Choice between geometric approximation and intrabar up/down volume, Z-Score thresholds for volume expansion, and related parameters.
• Visual Interface: Toggles for smart labels, dashboard table, font sizes, dashboard position, and color themes for bullish, bearish, and warning states.
Disclaimer
RSI Analytic Volume Matrix is provided for educational and research purposes only. It does not constitute financial advice and is not a signal generator. Any trading decisions you make based on this tool, or any other, are entirely your own responsibility. Always consider your own risk management rules and conduct your own analysis.

SmartMoneyConcept ProFlow StrategySmartMoneyConcept ProFlow is a complete SMC-based algo built for trending markets and clean volatility phases – especially on crypto pairs like BTC, ETH and perpetual futures.
It combines:
• Smart Money swing structure (BOS / CHoCH)
• Dynamic Support & Resistance levels
• Order Block–style gap detection
• Volatility normalization (ATR / Range / BBWidth)
• SuperTrend trend filter
• ATR & Volume-based exits, TP lock and session control
The goal: fewer random trades, more focused entries when structure + volatility + trend are in sync.
1. Core Idea
Smart Structure Levels (S/R)
– The strategy builds dynamic support/resistance using swing highs/lows.
– Breakouts above resistance or below support, with enough volatility (filter), become primary trade signals.
BOS / CHoCH Engine
– Tracks Break of Structure (BOS) and Change of Character (CHoCH).
– BOS up/down help define the current trend bias.
– CHoCH highlights potential reversals after a confirmed BOS in the opposite direction.
Order Block Gap Logic
– Detects displacement candles with gaps (based on ATR) to approximate OB-style “impulsive moves”.
– Bullish gaps can add confluence for long entries, bearish gaps for shorts.
Volatility-Aware Entries
– Uses normalized volatility (via ATR, Range or BBWidth).
– Filters out breakouts in dead, low-vol environments and focuses on moves with real expansion.
2. Trend & Risk Management Stack
SuperTrend Filter
– Optional “Only With SuperTrend Direction” to restrict entries to the current ST trend.
– ST flips can also force exits if you want to exit as soon as the main trend changes.
ATR-Based Stops & Trails
– ATR distance check to avoid ultra-tight stops that get chopped instantly.
– Three modes:
• StopOnly – classic fixed ATR stop.
• TrailOnly – trailing ATR-style stop.
• StopAndTrail – initial fixed stop that later trails with price.
Volume-Based Exits (Optional)
– Exit on extremely low volume (move losing participation).
– Or on opposite volume spikes (strong counter-pressure against your position).
– Or use Both for a more active volume management.
TP Lock Logic
– When unrealized profit reaches a chosen value, the position is closed and a “lock” can be applied.
– Use this lock to:
• block same-direction re-entries for that side, or
• allow them again depending on your preference.
3. Anti-Churn & Session Control
Anti-Churn Controls
– Minimum bars between entries.
– Cooldown after an ATR exit.
– Limit of max entries per bar.
Session Filter
– Restrict trading to a specific hourly window (e.g. main market session).
– Option to force close positions outside your active session.
– Handy for intraday traders who don’t want overnight or low-liquidity exposure.
4. SmartMoney Preset Modes
Preset Mode:
• EtherFlux – more flexible, for general breakout & volatility trading.
• SmartMoney – SMC-focused preset:
– Adjusted length, volatility filter and ATR settings.
– Option to disable exits from the strategy side (for manual risk control).
Switching presets automatically tunes multiple internal parameters so you don’t have to micromanage every input each time.
5. Visual Layer
This script has a complete visual suite to help you “read the tape”:
– Bar Colors by position and SuperTrend bias.
– Support / Resistance dots and lines (stepline style).
– Order Block markers (bullish / bearish gap labels).
– BOS / CHoCH labels to track structure shifts in real-time.
– Liquidation Zones (visual only)
• Approximate long and short liquidation areas based on assumed leverage.
• Shaded zones on the chart for quick liquidity map.
– Status Labels
• Session status (ACTIVE / OFF / DISABLED).
• Current position (LONG / SHORT / FLAT).
• TP Lock status (longs locked / shorts locked / no lock).
All visuals are designed for dark charts but also work on light themes with minor tweaks.
6. Quick Input Guide
• Levels Period & Volatility Filter – main structure sensitivity and breakout quality.
• Volatility Method – ATR / Range / BBWidth normalization for the vol filter.
• ATR Stop & Management – core risk rules: ATR multiplier, stop/trail mode, min ATR distance.
• SuperTrend Settings – trend bias and ST-flip exits.
• SmartMoney Preset – quick switch between EtherFlux and SmartMoney tuning.
• Volume Exits – low volume / opposite spike / both.
• Session Filter – hour-based trading window + optional forced flat outside session.
• Follow-Signal Mode – flip from long→short or short→long when signal reverses (signal-based rotation).
• TP Lock – secure profits at a fixed amount and optionally block same-direction re-entries.
• Liq Zones – visual only, for liquidity map (no direct trade logic).
How to Use (My Suggestion)
Start on 15m–4H charts for liquid pairs (BTC, ETH, majors).
Choose your preset:
– EtherFlux for more general breakout + vol trading.
– SmartMoney if you want stricter SMC behaviour.
Turn on SuperTrend + ATR stops for cleaner risk management.
Forward-test in replay / paper trading before using real capital.
Use the visual BOS/CHoCH + Liq Zones as context , not as blind signals.
Important
This is a backtest & research tool . It is not financial advice and does not guarantee profits. Always combine it with your own risk management, position sizing, and forward-testing before going live. Trading leveraged products and crypto can result in partial or full loss of capital.

Smart Money Toolkit - PD Engine Bias Map [KedArc Quant]Description
Smart Money is an advanced multi-layer Smart Money Concepts framework that automatically detects structure shifts, premium-discount zones, and institutional order flow.
It is built around the PD Engine, which calculates the midpoint of the most recent market swing and dynamically determines BUY or SELL bias based on where current price trades relative to that equilibrium. This toolkit visualizes structure, order blocks, and bias context in one clean map, giving traders an institutional-grade view without unnecessary signal clutter.
Why It Is Unique
- All CHoCH, BOS, Order Block, FVG, and PD logic are coded from scratch.
- Uses true equilibrium (50 percent PD midpoint) for dynamic bias.
- Optimized for stability and non-repainting behavior.
- Designed for clarity with minimal, performance-safe visuals.
Entry and Exit Logic (Discretionary Framework)
- This toolkit is not a signal generator. It provides market context that guides discretionary trading.
BUY Bias (Discount Zone)
- Price trades below PD Mid: the market is in discount.
- Wait for a bullish CHoCH or reaction from a demand OB or FVG before buying.
- Target 1 = PD Mid. Target 2 = next opposite OB or FVG.
SELL Bias (Premium Zone)
- Price trades above PD Mid: the market is in premium.
- Wait for a bearish CHoCH or reaction from a supply OB or FVG before shorting.
- Target 1 = PD Mid. Target 2 = next opposite OB or FVG.
Institutional concept sequence: Bias → Structure Shift → Confirmation → Execution.
Input Configuration
Swing Sensitivity - Determines how far back to identify HH and LL pivots.
OB / FVG Detection - Toggles visual Order Block or Fair Value Gap zones.
PD Engine - Shows PD midpoint line, zone shading, and bias table.
Multi-TF Bias Sync - Optionally reads a higher timeframe bias for confirmation.
Color Themes - Switch between light, dark, or institutional palettes.
Formula / Logic Summary
Concept Formula
PD Mid (Equilibrium) (Recent Swing High + Recent Swing Low) / 2
BUY Bias close < PD Mid
SELL Bias close > PD Mid
CHoCH / BOS Pivot-based structure reversal: HH→LL or LL→HH
Order Block Last bullish or bearish candle before displacement.
FVG Gap between prior candle high/low and next candle range.
These formulas follow the structure used in institutional Smart Money Concepts.
How It Helps Traders
- Shows institutional premium and discount zones visually.
- Defines clear directional bias before entry.
- Combines structure, order blocks, FVG, and equilibrium in one layout.
- Works on any timeframe or asset.
- Prevents emotional trades by giving objective bias context.
Glossary
PD Mid Midpoint between recent swing high and low (market fair value).
Premium Zone Price above PD Mid; sellers control.
Discount Zone Price below PD Mid; buyers control.
CHoCH Change of Character, first reversal signal.
BOS Break of Structure, trend continuation confirmation.
OB Order Block, last institutional candle before move.
FVG Fair Value Gap, price imbalance often revisited.
FAQ
Q: Is this a signal indicator?
A: No. It is a contextual framework that supports manual decision-making.
Q: Does it repaint?
A: No. All structure logic is confirmed on bar close.
Q: Does it work on all markets?
A: Yes. It is purely price-based and timeframe independent.
Q: When does bias change?
A: Only after a new confirmed swing high or low.
Q: Can it be backtested?
A: You can build strategies on top of this context using your own entry and exit rules.
Disclaimer
This script is provided for educational purposes only.
It is not financial advice.
Trading carries risk. Past performance does not guarantee future results.
Use proper risk management and test on demo accounts before applying to live markets.

SMC Trend Reversal by Pooja🌟 SMC Trend Reversal by Pooja — CHoCH + BOS + RSI Confirmation
🔥 Smart Money Concepts • Trend Reversal Detection • Multi-Asset Optimized
The SMC Trend Reversal by Pooja is a powerful market-structure indicator designed for traders who follow Smart Money Concepts (SMC) and want to identify trend reversals, BOS, and CHoCH with high clarity.
It blends pivot-based structure breaks, RSI confirmation, and an optional session filter, giving traders a clean and reliable view of market shifts across Crypto, Forex, Indices, and Equity Derivatives.
✨ 🔰 Why SMC Matters in Crypto & Forex?
Both Crypto and Forex markets:
Trade 24/7 / 5 days with high volatility
React strongly to liquidity zones, market structure shifts, and smart money footprints
Often reverse sharply after liquidity grabs
Follow clean CHoCH → BOS → Trend progression sequences
This is why CHoCH (Change of Character) and BOS (Break of Structure) are crucial tools used by professional SMC traders to catch early trend reversals.
This indicator automates that process for you.
No clutter. No repaints. No noise.
Just pure SMC structure.
🚀 Key Features
🟣 CHoCH Detection (Change of Character)
Detects when the market shifts direction
A CHoCH appears when the trend flips from down → up or up → down
Highlights the earliest sign of a trend reversal
Draws a clean CHoCH line across structure
Works beautifully in volatile markets like Crypto & Forex
🔵 BOS Detection (Break of Structure)
Identifies structural continuation in the same direction
Helps confirm the new trend after CHoCH
Clear BOS lines to visualize progression of market flow
Ideal for trend-following and breakout traders
🧠 RSI-Based Confirmation (Optional)
To avoid fake CHoCH signals, the indicator uses RSI filtering:
RSI > Upper Level → Show “B” Buy Label
RSI < Lower Level → Show “S” Sell Label
This improves accuracy especially in:
Fast crypto markets (BTC, ETH, SOL etc.)
Liquidity-driven assets (Forex, Indices)
⏱️ Session Block (Asia/Kolkata Compatible)
Avoid signals in the first few minutes of market open or in volatile windows.
Block signals in a selected time range
Perfect for Indian market opening volatility (09:00–09:25)
🎯 Clean, Minimal, Easy-to-Read Visuals
✔ Horizontal structural lines
✔ Color-coded CHoCH and BOS
✔ Buy (B) / Sell (S) labels only when meaningful
✔ No unnecessary clutter
✔ Suitable for both beginners and advanced SMC traders
📢 Built-In Alerts
Receive notifications for:
🔔 Bullish CHoCH
🔔 Bearish CHoCH
🔔 Bullish BOS
🔔 Bearish BOS
Perfect for mobile, desktop, and webhook automation.
📈 How It Helps Your Trading
✔ Catch early trend reversals with confidence
✔ Avoid false signals with RSI filtering
✔ Trade like Smart Money (Institutional concepts)
✔ Works on all timeframes — scalping to swing
✔ Specially powerful on Crypto & Forex due to their structure-driven nature
✔ Cleaner charts → Better decisions → Higher probability trades
🧩 Who Should Use This Indicator?
✔ SMC / ICT style traders
✔ Breakout and trend-following traders
✔ Reversal traders
✔ Crypto & Forex scalpers
✔ Option buyers looking for early trend shifts
✔ Intraday NIFTY / BANKNIFTY traders
⚠️ Disclaimer
This indicator is for educational purposes and market analysis only.
It does not guarantee profits. Always practice risk management and test your settings before using it live.

NeuraEdge Block Trades v1.0NEURAEDGE BLOCK TRADES
═══════════════════════════════════════════════════════════════════════
We are excited to release Block Trades!
WHY THIS INDICATOR EXISTS?
Retail traders face a fundamental challenge: institutions move markets, but their activity is hidden. When smart money accumulates at support or distributes at resistance, retail traders often find themselves on the wrong side of the move.
Understanding where institutions are actively buying or selling is crucial for:
• Validating trade setups with volume confirmation
• Identifying supply and demand zones that actually hold
• Avoiding false breakouts driven by retail sentiment
• Spotting accumulation before major moves up
• Detecting distribution before major moves down
Most volume indicators simply show size without context. Block Trades was created to bridge this gap by detecting abnormally large volume bars and determining their directional bias, giving retail traders insight into institutional activity.
═══════════════════════════════════════════════════════════════════════
WHAT IT DOES:
Block Trades identifies volume spikes that likely represent institutional order flow and classifies them as buying pressure, selling pressure, or contested zones. The indicator then validates these prints against directional flow analysis and groups nearby prints into accumulation or distribution clusters.
This helps you answer critical questions:
• Is this support level being defended by institutions?
• Are smart money players distributing into this rally?
• Is heavy volume confirming my trade or warning against it?
• Where are institutional interest zones forming?
KEY FEATURES:
• Multi-tier volume detection (Large: 2x, Huge: 3x, Massive: 5x average)
• Directional classification with flow validation
• Accumulation/distribution zone detection
• Print clustering for institutional interest areas
• Confluence scoring system (0-10 points)
• Real-time statistics dashboard
• Clean, minimal chart labels
═══════════════════════════════════════════════════════════════════════
HOW IT WORKS:
VOLUME SPIKE DETECTION
The indicator monitors volume against a moving average baseline. When current volume significantly exceeds this average (default thresholds: 2x, 3x, 5x), it flags the bar as a potential institutional print.
DIRECTIONAL CLASSIFICATION
Buy Print: Large volume + closes in top 70% of range
Sell Print: Large volume + closes in bottom 70% of range
Neutral Print: Large volume + mid-range close (absorption/contested)
The close position within the bar's range reveals who won the battle. A bar with massive volume that closes near its high indicates aggressive buying. The same volume closing near the low indicates aggressive selling.
FLOW VALIDATION
Each print is validated against underlying institutional flow calculations. This filters out volume spikes that don't align with directional pressure, significantly reducing false signals. Buy prints require bullish flow, sell prints require bearish flow.
ACCUMULATION & DISTRIBUTION ZONES
When multiple prints occur at similar price levels with consistent direction:
• Repeated buy prints + bullish trend = Accumulation (institutions building positions)
• Repeated sell prints + bearish trend = Distribution (institutions unloading positions)
These zones often become powerful support/resistance levels because institutions have established significant positions there.
PRINT CLUSTERING
The indicator groups nearby prints (within configurable ATR distance) into clusters. When 3 or more prints form a cluster, it marks an institutional interest zone. These clusters frequently act as price magnets and reversal points.
PRINT CLUSTERING
The indicator groups nearby prints (within configurable ATR distance) into clusters. When 3 or more prints form a cluster, it marks an institutional interest zone. These clusters frequently act as price magnets and reversal points.
CONFLUENCE SCORING
Each print receives a confluence score (0-10 points) based on:
• Volume size (Massive: +3, Huge: +2, Large: +1)
• Flow alignment (+2 points, configurable)
• Trend alignment (+1)
• New high/low made (+1)
• Extreme close position (+1)
Prints with 5+ points receive a star marker, indicating ultra-high conviction setups.
═══════════════════════════════════════════════════════════════════════
HOW TRADERS USE IT:
USE CASE 1: TRADE VALIDATION
Your system signals a long entry at support. Check Block Trades:
• Buy prints present at this level? Institutions defending = Take the trade
• Sell prints present? Institutions distributing = Skip or wait
• No prints? Proceed with normal risk management
USE CASE 2: IDENTIFYING EXHAUSTION
Price rallies to resistance with heavy volume:
• Sell prints appear = Distribution, institutions unloading into strength
• Likely reversal coming, consider shorts or exit longs
• Confirmed by multiple sell prints = High conviction reversal setup
USE CASE 3: FINDING SUPPORT/RESISTANCE
Accumulation cluster forms at 450 level:
• Multiple buy prints over several sessions
• Institutions building positions at this price
• 450 becomes high-probability support for future pullbacks
• Use for entries or stop placement
USE CASE 4: BREAKOUT CONFIRMATION
Price breaks above key resistance:
• Buy print on breakout bar = Real institutional participation
• High confluence score (5+) = Ultra-high conviction
• Fake breakout would show sell prints or no prints
USE CASE 5: AVOIDING TRAPS
Price spikes up on huge volume:
• Sell print appears (closes low in range) = Trap
• Institutions selling into retail FOMO
• Avoid chasing, prepare for reversal
═══════════════════════════════════════════════════════════════════════
VISUAL ELEMENTS:
ON-CHART LABELS
Buy Print: Green label below bar showing size (LARGE/HUGE/MASSIVE)
Sell Print: Red label above bar showing size
Contested Print: Orange label at bar high (large volume, mid-range close)
Accumulation: Green "ACCUM" label with diamond symbol
Distribution: Red "DISTRIB" label with diamond symbol
WHAT CONTESTED MEANS:
When a bar has massive volume but closes in the middle of its range (neither top nor bottom 70%), it indicates a battle between buyers and sellers with no clear winner. This often occurs at:
• Major support/resistance levels where institutions are absorbing supply/demand
• Transition zones before a directional move
• Areas of genuine price discovery and uncertainty
Contested prints can signal absorption (institutions quietly building positions) or genuine indecision. Watch for follow-through on the next bar to determine which side won.
LABEL MODIFIERS
∆ checkmark = Flow validated (institutional flow aligns with print)
Star symbol = High confluence (5+ points, ultra-high conviction)
CLUSTER ZONES
Semi-transparent boxes marking areas where multiple prints occurred
Extend to the right to show ongoing institutional interest zones
Color-coded: green for bullish clusters, red for bearish clusters
DASHBOARD (TOP RIGHT)
• Current volume state and ratio
• Institutional flow direction
• Cumulative trend direction
• Recent print count (last 20 bars)
• Active cluster count
• Volume thresholds
STATISTICS (BOTTOM LEFT)
• Total session prints
• Buy/sell percentage split
═══════════════════════════════════════════════════════════════════════
SETTINGS:
PRINT DETECTION
• Volume Lookback Period: 20 bars (for average calculation)
• Large Print Threshold: 2.0x average
• Huge Print Threshold: 3.0x average
• Massive Print Threshold: 5.0x average
• Min Candle Size: 0.3x ATR (filters doji bars)
CLASSIFICATION
• Directional Threshold: 70% (how far in range to qualify as buy/sell)
• Show Neutral Prints: Toggle contested zones
• Require New High/Low: Optional stricter filter
INSTITUTIONAL FLOW
• Enable Flow Confluence: On/Off toggle
• Flow Confluence Weight: 2 points (adjustable 1-5)
CLUSTERING
• Enable Clustering: On/Off
• Cluster Distance: 1.0x ATR (how close prints must be)
• Min Prints for Cluster: 3 prints
• Show Cluster Zones: On/Off
DISPLAY
• Show Print Labels: Toggle all labels
• Show Accumulation/Distribution/Contested Labels: Toggle special labels
• Label Size: Tiny/Small/Normal
• Colors: Customizable buy/sell/neutral colors
FILTERS
• Minimum Volume: 0 (set threshold to ignore low volume bars)
• Session Filter: Avoid first/last 15 minutes (low liquidity)
═══════════════════════════════════════════════════════════════════════
BEST PRACTICES:
DO:
✓ Use as confluence with your primary trading system
✓ Pay attention to accumulation/distribution zones
✓ Look for high confluence prints (5+ stars)
✓ Validate breakouts with print direction
✓ Use cluster zones as future support/resistance
✓ Combine with higher timeframe analysis
✓ Works best on liquid instruments (major pairs, indices, large cap stocks)
DON'T:
✗ Trade prints as standalone buy/sell signals
✗ Ignore the directional classification (context matters)
✗ Use on low-volume instruments (prints less reliable)
✗ Chase every print without confluence confirmation
✗ Trade during low liquidity hours (first/last 15 min)
✗ Expect 100% accuracy (it's a confluence tool, not crystal ball)
OPTIMAL TIMEFRAMES:
• 5-minute to 1-hour charts for intraday trading
• 1-hour to 4-hour charts for swing trading
• Daily charts for position trading
BEST INSTRUMENTS:
• Major forex pairs (EUR/USD, GBP/USD, etc.)
• Index futures (ES, NQ, YM)
• High-volume stocks (SPY, QQQ, TSLA, AAPL, etc.)
• Major cryptocurrencies (BTC, ETH)
═══════════════════════════════════════════════════════════════════════
IMPORTANT DISCLAIMERS
METHODOLOGY DISCLAIMER
This indicator identifies abnormally large volume bars and estimates their directional bias based on price action and flow analysis. It does NOT have access to:
• Actual dark pool transaction data
• Off-exchange Alternative Trading System (ATS) prints
• Level 2 order book data
• Individual trade sizes or timestamps
• Institutional order identification
The prints detected are estimates based on publicly available volume and price data from TradingView. They indicate probable institutional activity patterns but are not confirmed block trades or dark pool executions.
USAGE DISCLAIMER
Block Trades is designed as a CONFLUENCE tool to validate trade setups - not as a standalone trading system. The indicator does not:
• Generate specific entry/exit signals
• Provide stop loss or take profit levels
• Constitute a complete trading strategy
• Guarantee profitable trades
Prints should be interpreted within the context of:
• Your overall trading strategy
• Market structure and trend
• Support/resistance levels
• Risk management rules
• Multiple timeframe analysis
RISK DISCLAIMER
Trading involves substantial risk of loss and is not suitable for every investor. Past performance is not indicative of future results. This indicator is a tool for technical analysis only and does NOT constitute financial advice, investment advice, trading advice, or a recommendation to buy or sell any securities or financial instruments.
You should not make any investment decision without conducting your own research and due diligence. The accuracy, completeness, and timeliness of the information provided by this indicator is not guaranteed. No representation is being made that using this indicator will guarantee profits or prevent losses.
By using this indicator, you acknowledge that you understand and accept all risks associated with trading, and you agree that the developer is not liable for any losses you may incur.
═══════════════════════════════════════════════════════════════════════
ALERTS
Available alert conditions:
• Massive Buy Print
• Massive Sell Print
• Huge Buy Print
• Huge Sell Print
• Accumulation Detected
• Distribution Detected
• High Confluence Buy (5+ points)
• High Confluence Sell (5+ points)
Happy Trading!

Smart Money Concepts [Riz]Smart Money Concepts is a comprehensive technical analysis tool for identifying institutional trading patterns and market structure. This indicator combines Smart Money Concepts (SMC), ICT methodology, and Wyckoff principles into one professional tool.
✨ KEY FEATURES
📊 VOLUMETRIC ORDER BLOCKS
• Visual representation of supply/demand zones with volume distribution
• Horizontal volume bars showing buy/sell composition inside each Order Block
• Automatic mitigation tracking
• Breaker Block detection (invalidated OBs acting as reversal zones)
• Strength rating system: ★ Weak, ★★ Medium, ★★★ Strong
• ATR-based size filtering to show only significant zones
📈 MARKET STRUCTURE DETECTION
• Break of Structure (BOS) and Change of Character (CHoCH) identification
• Higher Highs (HH), Higher Lows (HL), Lower Highs (LH), Lower Lows (LL) labels
• Internal structure pivots (iH/iL) for intraday analysis
• Auto-adjusting swing length based on timeframe
• Configurable confirmation methods (Close vs Wick-based)
💎 FAIR VALUE GAPS (FVG)
• Automatic detection of bullish and bearish imbalances
• Configurable mitigation percentage (default 50%)
• Visual tracking until gaps are filled
• Separate color schemes for clarity
💧 LIQUIDITY ANALYSIS
• Buy Side Liquidity (BSL) identification at swing highs
• Sell Side Liquidity (SSL) identification at swing lows
• Automatic sweep detection with visual confirmation
• Real-time alerts when liquidity is taken
⚖️ PREMIUM & DISCOUNT ZONES
• Dynamic range calculation based on configurable lookback period
• Equilibrium (EQ) level identification
• Previous Day High (PDH) and Previous Day Low (PDL) levels
• Helps identify favorable entry zones
📊 REAL-TIME DASHBOARD
• Live statistics on all detected patterns
• Active Order Blocks and FVGs count
• BOS/CHoCH occurrence tracking
• Liquidity sweep counters
• Recent market activity indicators
• Current trend bias display
• Fully customizable position and size
⚙️ CUSTOMIZATION OPTIONS
All aspects are fully customizable:
• Swing Length (1-50 bars) with auto-adjust for timeframe
• Max Active Order Blocks (10-100)
• Volume bar position (Left/Right) with mirror option
• Volume bar width percentage (10-50%)
• ATR size filter for Order Blocks
• Strength rating method (Touches/Age/Distance/Volume/Combined)
• All colors and transparency levels
• Dashboard position (9 locations available)
• Comprehensive alert system for all events
🎓 HOW IT WORKS
ORDER BLOCKS: Identified at the last candle before a Break of Structure. These represent institutional supply and demand zones. Volume is estimated based on candle characteristics and displayed as horizontal bars.
MARKET STRUCTURE: Tracks pivot highs and lows to determine if price is making Higher Highs/Higher Lows (bullish structure) or Lower Highs/Lower Lows (bearish structure). BOS indicates trend continuation, while CHoCH signals potential trend reversal.
LIQUIDITY: Swing highs represent Buy Side Liquidity where short positions have their stop losses. Swing lows represent Sell Side Liquidity where long positions have stop losses. The indicator tracks when these levels are "swept" by price.
FAIR VALUE GAPS: Three-candle patterns where the current candle's range doesn't overlap with the candle two bars ago, creating price imbalances that often get filled later.
📚 BEST PRACTICES
• Use on all timeframes - Auto-adjust feature optimizes settings automatically
• Look for confluence - Best setups occur when multiple concepts align (e.g., Order Block + liquidity sweep + discount zone)
• Consider risk/reward - Use Premium/Discount zones to identify favorable entry areas
• Respect market context - Order Blocks in the direction of overall trend tend to be more reliable
• Volume matters - Higher volume percentages in the expected direction may indicate stronger zones
⚠️ IMPORTANT NOTES
EDUCATIONAL TOOL: This indicator is designed for analysis and education, not as trading signals or investment advice.
VOLUME ESTIMATION: Buy/sell volume distribution is estimated based on candle characteristics since true buy/sell volume data is not available in Pine Script.
NO GUARANTEES: Past performance is not indicative of future results. All trading involves substantial risk.
RISK MANAGEMENT: Always use proper risk management and seek additional confirmation before making trading decisions.
OBJECT LIMITS: On very fast timeframes (1m, 5m) in highly volatile markets, the indicator may approach Pine Script's 500-object limit. Reduce max OBs/FVGs in settings if needed.
🔧 TECHNICAL SPECIFICATIONS
• Pine Script Version: v6
• Indicator Type: Overlay (displays on price chart)
• Maximum Objects: Optimized to stay within Pine Script limits
• Performance: Efficient rendering with configurable history management
• Updates: Real-time on every bar close
📖 METHODOLOGY
This indicator combines concepts from:
• Inner Circle Trader (ICT) methodology
• Smart Money Concepts (SMC) framework
• Wyckoff market analysis principles
• Order flow and volume spread analysis
⚖️ DISCLAIMER
This indicator is for educational and informational purposes only. It is not financial advice. Trading financial instruments carries substantial risk and may not be suitable for all investors. Past performance is not indicative of future results. Always conduct your own research and consult with a licensed financial advisor before making any investment decisions. The author assumes no responsibility for any losses incurred from using this indicator.

Change in State of Delivery CISD [AlgoAlpha]🟠 OVERVIEW
This script tracks how price “changes delivery” after failed attempts to push in one direction. It builds swing levels from pivots, watches for those levels to be wicked, and then checks if price delivers cleanly in the opposite direction. When the pattern meets the script’s tolerance rules, it marks a Change in State of Delivery (CISD). These CISD levels are drawn as origin lines and are used to spot shifts in intent, failed pushes, and continuation attempts. A CISD becomes stronger when it forms after opposing liquidity is swept within a defined lookback.
🟠 CONCEPTS
The script first defines structure using swing highs/lows. These levels act as potential liquidity points. When price wicks through a swing, the script registers a mitigation event. After this, it looks for a reversal-style candle sequence: a failed push, followed by a counter-move strong enough to pass a tolerance ratio. This ratio compares how far price expanded away from the failed attempt versus the counter-move that followed. If the ratio is high enough, this becomes a CISD. The idea is simple: liquidity interaction sets context , and the tolerance logic identifies actual intent . CISD levels and sweep markers combine these two ideas into a clean map of where delivery flipped.
🟠 FEATURES
Liquidity tracking: marks swing highs/lows and updates them until expiry
Liquidity sweep confirmation when CISD aligns with recent mitigations
Alert conditions for all key events: mitigations, CISDs, and strong CISDs
🟠 USAGE
Setup : Add the script to your chart. Use it on any timeframe where swing behavior matters. Set the Swing Period for how wide a pivot must be. Set Noise Filter to control how strict the CISD detection is. Liquidity Lookback defines how recent a wick must be to confirm a sweep.
Read the chart : Origin lines mark where the CISD began. A green line signals bullish intent; a red line signals bearish intent. ▲ and ▼ shapes show CISDs that form after liquidity is swept, these mark strong signals for potential entry. Swing dots show recent swing highs/lows. Candle colors follow the latest CISD trend.
Settings that matter : Increasing Swing Period produces fewer but stronger swings. Raising Noise Filter requires cleaner counter-moves and reduces false CISDs. Liquidity Lookback controls how strict the sweep confirmation is. Expiry Bars decides how long swing levels remain active.

Volume-Confirmed FTR Zones [AlgoPoint]FTR Zone Indicator — Fail To Return Zones (With Volume Confirmation)
Advanced Smart Money Zone Detection for Institutional Orderflow
The FTR Zone Indicator is a professional-grade tool designed for traders who follow Smart Money Concepts (SMC), ICT methodologies, or institutional orderflow. It automatically detects Fail To Return Zones (FTR) — high-probability supply and demand areas formed after strong displacement moves.
By combining impulse detection, base identification, and volume confirmation, this indicator highlights zones where price is most likely to react, reverse, or mitigate shortly after structure breaks.
⸻
⭐ What Are FTR Zones?
FTR zones (Fail To Return zones) are price areas where:
1. A strong displacement / impulse candle is formed
2. That impulse originates from a small consolidation (base)
3. Price moves away aggressively
4. AND fails to return immediately to the origin area
These zones often indicate:
• Institutional orders
• Imbalance
• Hidden liquidity
• Origin of a trend leg
• High-probability mitigation points
This indicator fully automates the detection and visualization of such areas.
🔍 How the Indicator Works
1. Impulse Detection
The indicator identifies a valid impulse candle using:
• ATR-based bar range filter
• Trend-aligned candle body direction
• Optional volume confirmation
Only large, meaningful institutional candles qualify — filtering out noise.
2. Base Zone Identification
Before every impulse, the tool finds the micro-consolidation base using:
• Highest high of the last X bars
• Lowest low of the last X bars
This base becomes the potential FTR zone.
3. FTR Zone Creation
When a valid impulse is detected:
• Bullish impulse → Demand FTR zone
• Bearish impulse → Supply FTR zone
The zone is immediately drawn on the chart using box.new().
4. Zone Extension
Every zone continuously extends to the right as price evolves, allowing you to track:
• Mitigation
• Retests
• Reaction points
• Liquidity sweeps
5. Invalidation Logic
Zones automatically delete when violated:
• Demand zone invalid if close < zone low
• Supply zone invalid if close > zone high
This keeps the chart clean and helps focus only on active, high-value areas.
🎛️ Key Features
✔ Automatic FTR Zone Detection
Instantly identifies institutional origin zones based on real impulse and displacement.
✔ Volume-Based Filtering
Ensures only high-volume impulses (true institutional orders) create zones.
✔ Supply & Demand Coloring
• Bullish FTR → Demand Zone (Teal tone)
• Bearish FTR → Supply Zone (Red tone)
✔ Safe Zone Storage
Fault-tolerant logic ensures no array errors, invalid zones, or broken visuals.
✔ Auto-Extending Boxes
Real-time zone updates with precise historical mapping.
✔ Smart Invalidation
Zone is removed only when fully broken, preventing false signals.
✔ Clean, Non-Repainting Logic
Impulse detection and zone placement are confirmed only on bar close.
📈 How to Use It (Example Schenarios)
For Reversals or Continuations
• Look for price reacting or mitigating inside a zone
• Use as entry confirmation in trend continuations
• Combine with FVG, BOS/CHOCH, liquidity sweeps, or premium/discount zones
For Scalping or Intraday Trading
• High-probability countertrend entries
• Reaction-based setups at institutional footprints
For Swing Traders
• Identify weekly/daily origin zones
• Plan entries around large displacement points

Momentum Pulse Strategy v1How does this strategy work
1. It analyses current market condition based on moving averages and determines Bullish or Bearish market condition
2. Once we confirm the current market condition, we look for a specific type of candle that has taken the liquidity which is the C1 candle marked on chart
3. Next we look for failure of that liquidity and a candle that engulfs it which confirms the trade and automatically shows the entry,sl and take profits
4. We always enter on the next candle after confirmation which is confirmed by an arrow
Guide
Alerts for Bullish/Bearish market conditions, C1 and confirmation candle available
Master alert for All the conditions also available. On and off also available for all the alert types
All the visuals are customisable in settings
Customisable take profit levels
Entry is the Gold line. SL is the red line and green lines are the Tps
Backtest the trades given by the indicator and to know the max drawdown based on the asset and timeframe
For any other info contact me on tradingview

Market Structure Trailing Stop MTF [Inspired by LuxAlgo]# Market Structure Trailing Stop MTF
**OPEN-SOURCE SCRIPT**
*208k+ views on original · Modified for MTF Support*
This indicator is a direct adaptation of the renowned **Market Structure Trailing Stop** by **LuxAlgo** (original script: [Market Structure Trailing Stop ]()). The core logic remains untouched, providing dynamic trailing stops based on market structure breaks (CHoCH/BOS). The **only modification** is the addition of **Multi-Timeframe (MTF) support**, allowing users to apply the trailing stops and structures from **higher timeframes (HTF)** directly on their current chart. This enhances usability for traders analyzing cross-timeframe confluence without switching charts.
**Special thanks to LuxAlgo** for releasing this powerful open-source tool under CC BY-NC-SA 4.0. Your contributions to the TradingView community have inspired countless traders—grateful for the solid foundation!
## 🔶 How the Script Works: A Deep Dive
At its heart, this indicator detects **market structure shifts** (bullish or bearish breaks of swing highs/lows) and uses them to generate **adaptive trailing stops**. These stops trail the price while protecting profits and acting as dynamic support/resistance levels. The MTF enhancement pulls this logic from user-specified higher timeframes, overlaying HTF structures and stops on the lower timeframe chart for seamless multi-timeframe analysis.
### Core Logic (Unchanged from LuxAlgo's Original)
1. **Pivot Detection**:
- Uses `ta.pivothigh()` and `ta.pivotlow()` with a user-defined lookback (`length`) to identify swing highs (PH) and lows (PL).
- Coordinates (price `y` and bar index/time `x`) are stored in persistent variables (`var`) for tracking recent pivots.
2. **Market Structure Detection**:
- **Bullish Structure (BOS/CHoCH)**: Triggers when `close > recent PH` (break above swing high).
- If `resetOn = 'CHoCH'`, resets only on major shifts (Change of Character); otherwise, on all breaks.
- Sets trend state `os = 1` (bullish) and highlights the break with a horizontal line (dashed for CHoCH, dotted for BOS).
- Initializes trailing stop at the local minimum (lowest low since the pivot) using a backward loop: `btm = math.min(low , btm)`.
- **Bearish Structure**: Triggers when `close < recent PL`, mirroring the bullish logic (`os = -1`, local maximum for stop).
- Structure state `ms` tracks the break type (1 for bull, -1 for bear, 0 neutral), resetting based on user settings.
3. **Trailing Stop Calculation**:
- Tracks **trailing max/min**:
- On new bull structure: Reset `max = close`.
- On new bear: Reset `min = close`.
- Otherwise: `max = math.max(close, max)` / `min = math.min(close, min)`.
- **Stop Adjustment** (the "trailing" magic):
- On fresh structure: `ts = btm` (bull) or `top` (bear).
- In ongoing trend: Increment/decrement by a percentage of the max/min change:
- Bull: `ts += (max - max ) * (incr / 100)`
- Bear: `ts += (min - min ) * (incr / 100)`
- This creates a **ratcheting effect**: Stops move favorably with the trend but never against it, converging toward price at a controlled rate.
- **Visuals**:
- Plots `ts` line colored by trend (teal for bull, red for bear).
- Fills area between `close` and `ts` (orange on retracements).
- Draws structure lines from pivot to break point.
4. **Edge Cases**:
- Variables like `ph_cross`/`pl_cross` prevent multiple triggers on the same pivot.
- Neutral state (`ms = 0`) preserves prior `max/min` until a new structure.
### MTF Enhancement (Our Addition)
- **request.security() Integration**:
- Wraps the entire core function `f()` in a security call for each timeframe (`tf1`, `tf2`).
- Returns HTF values (e.g., `ts1`, `os1`, structure times/prices) to the chart's context.
- Uses `lookahead=barmerge.lookahead_off` for accurate historical repainting-free data.
- Structures are drawn using `xloc.bar_time` to align HTF lines precisely on the LTF chart.
- **Multi-Output Handling**:
- Separate plots/fills/lines for each TF (e.g., `plot_ts1`, `plot_ts2`).
- Colors and toggles per TF to distinguish HTF1 (e.g., teal/red) from HTF2 (e.g., blue/maroon).
- **Benefits**: Spot HTF bias on LTF entries, e.g., enter longs only if both TF1 (1H) and TF2 (4H) show bullish `os=1`.
This keeps the script lightweight—**no repainting, max 500 lines**, and fully compatible with LuxAlgo's original behavior when TFs are set to the chart's timeframe.
## 🔶 SETTINGS
### Core Parameters
- **Pivot Lookback** (`length = 14`): Bars left/right for pivot detection. Higher = smoother structures, fewer signals; lower = more noise.
- **Increment Factor %** (`incr = 100`): Speed of stop convergence (0-∞). 100% = full ratchet (mirrors max/min exactly); <100% = slower trail, reduces whipsaws.
- **Reset Stop On** (`'CHoCH'`): `'CHoCH'` = Reset only on major reversals (dashed lines); `'All'` = Reset on every BOS/CHoCH (tighter stops).
### MTF Support
- **Timeframe 1** (`tf1 = ""`): HTF for first set (e.g., "1H"). Empty = current chart.
- **Timeframe 2** (`tf2 = ""`): Second HTF (e.g., "4H"). Enables dual confluence.
### Display Toggles
- **Show Structures** (`true`): Draws horizontal lines for breaks (per TF colors).
- **Show Trailing Stop TF1/TF2** (`true`): Plots the stop line.
- **Show Fill TF1/TF2** (`true`): Area fill between close and stop.
### Candle Coloring (Optional)
- **Color Candles** (`false`): Enables custom `plotcandle` for body/wick/border.
- **Candle Color Based On TF** (`"None"`): `"TF1"`, `"TF2"`, or none. Colors bull trend green, bear red.
- **Candle Colors**: Separate inputs for bull/bear body, wick, border (e.g., solid green body, transparent wick).
### Alerts
- **Enable MS Break Alerts** (`false`): Notifies on structure breaks (bull/bear per TF) **only on bar close** (`barstate.isconfirmed` + `alert.freq_once_per_bar_close`).
- **Enable Stop Hit Alerts** (`false`): Triggers on stop breaches (long/short per TF), using `ta.crossunder/crossover`.
### Colors
- **TF1 Colors**: Bullish (teal), Bearish (red), Retracement (orange).
- **TF2 Colors**: Bullish (blue), Bearish (maroon), Retracement (orange).
- **Area Transparency** (`80`): Fill opacity (0-100).
## 🔶 USAGE
Trailing stops shine in **trend-following strategies**:
- **Entries**: Use structure breaks as signals (e.g., long on bullish BOS from HTF1).
- **Exits**: Trail stops for profit-locking; alert on hits for automation.
- **Confluence**: Overlay HTF1 (e.g., 1H) for bias, HTF2 (e.g., Daily) for major levels—enter LTF only on alignment.
- **Risk Management**: Lower `incr` avoids early stops in chop; reset on `'All'` for aggressive trailing.
! (i.imgur.com)
*HTF1 shows bullish structure (teal line), trailing stop ratchets up—long entry confirmed on LTF pullback.*
! (i.imgur.com)
*TF1 (blue) bearish, TF2 (red) neutral—avoid shorts until alignment.*
! (i.imgur.com)
*Colored based on TF1 trend: Green bodies on bull `os=1`.*
Pro Tip: Test on demo—pair with LuxAlgo's other tools like Smart Money Concepts for full structure ecosystem.
## 🔶 DETAILS: Mathematical Breakdown
On bullish break:
- Local min: `btm = ta.lowest(n - ph_x)` (optimized loop equivalent).
- Stop init: `ts = btm`.
- Update: `Δmax = max - max `, `ts_new = ts + Δmax * (incr/100)`.
Bearish mirrors with `Δmin` (negative, so decrements `ts`).
In MTF: HTF `time` aligns lines via `line.new(htf_time, level, current_time, level, xloc.bar_time)`.
No logs/math libs needed—pure Pine v5 efficiency.
## Disclaimer
This is for educational purposes. Not financial advice. Backtest thoroughly. Original by LuxAlgo—modify at your risk. See TradingView's (www.tradingview.com). Licensed under CC BY-NC-SA 4.0 (attribution to LuxAlgo required).

OG FlowMasterOG FlowMaster is a precision tool designed to detect and visualize Imbalance Zones key areas where price moved inefficiently, leaving behind potential rebalancing points.
By tracking these institutional footprints, OG FlowMaster helps traders anticipate liquidity grabs, reversals, and continuation moves with clarity and confidence.
Whether you trade indices, forex, or commodities, it maps out the zones where price may seek balance between demand and supply turning invisible inefficiencies into visible trading opportunities.
🧠 Trade between the OGs. Master the Flow.

Smart Volume Imbalance (SVI) — Lower Panel (MNQ tuned)How to use & interpret (quick guide — tuned for MNQ)
What SVI shows
SVI > 0 — price move is directionally efficient with supportive volume (bullish smart flow).
SVI < 0 — price move is directionally efficient with selling pressure (bearish smart flow).
Large |SVI| (default threshold ±1.5) indicates institutional-strength moves worth respecting.
Absorption (orange/yellow marker): high volume but small candle body → potential smart accumulation/distribution (often precedes directional moves).
Primary signals
Entry (momentum): SVI crosses above +svThresh on pullbacks aligned with trend (use price structure to confirm).
Fade / Short: SVI falls below -svThresh at or near resistance, especially with bearish divergence.
Divergence: Price makes higher high but SVI makes lower high → likely smart-money sell; be cautious.
Default parameter reasoning for MNQ
volLen = 20, spreadLen = 20 — balances responsiveness and noise for a fast future.
normLen = 50, smoothLen = 8 — reduces tick noise but still responsive to MNQ spikes.
absorbVolMul = 1.8 — flags volume ~80% above average as significant; tweak if your data source reports higher/lower baseline.
Tuning tips
If you see too many false signals, increase normLen or smoothLen (more smoothing).
If you want earlier signals (more noise), lower smoothLen and normLen.
For lower-timeframes (1s/1m) you may need shorter SMAs; for higher-timeframes (5m+) defaults often work well.
Practical workflow
Use SVI in a separate lower panel while trading MNQ on your preferred timeframe (1m–5m are common).
Combine SVI with structure: only take bullish SVI signals above a prior structure support / after CHoCH, etc.
Watch absorption zones near highs/lows — they often signal where smart money is stepping in/out.

Liquidity Swap Detector Ultimate - Cedric JeanjeanAdvanced Smart Money Concepts indicator designed to detect high-probability liquidity sweeps and institutional order flow reversals. This professional-grade tool combines multiple ICT (Inner Circle Trader) strategies to identify optimal entry points.
═══════════════════════════════════════════════════════
📊 KEY FEATURES:
✅ Smart Swing Detection
- Identifies confirmed swing highs and lows using adaptive lookback periods
- Eliminates false signals through double-confirmation logic
- Detects liquidity grabs at key market structure points
✅ Fair Value Gap (FVG) Analysis
- Multi-timeframe FVG detection for enhanced accuracy
- Filters imbalances by minimum size threshold
- Combines current timeframe and higher timeframe FVGs
✅ Advanced Volatility Filter
- ATR-based volatility analysis to avoid low-quality setups
- Adjustable volatility threshold (default 0.35%)
- Ensures entries during optimal market conditions
✅ Precision Signal Generation
- LONG signals: Confirmed swing lows + FVG + volatility confirmation
- SHORT signals: Confirmed swing highs + FVG + volatility confirmation
- Clear visual markers with price labels
✅ Comprehensive Alert System
- Three alert types: Simple, Detailed, JSON (for webhooks)
- Separate LONG/SHORT alert controls
- Compatible with MT5 integration via webhooks
- TradingView native alertcondition support
✅ Professional Dashboard
- Real-time ATR monitoring
- Volatility percentage display
- FVG status indicator
- Alert status tracker
═══════════════════════════════════════════════════════
⚙️ CUSTOMIZABLE PARAMETERS:
🔹 Lookback Swing (1-50): Defines swing detection sensitivity
🔹 ATR Multiplier: Controls wick filter strength
🔹 Volatility Filter: Minimum required market volatility (%)
🔹 FVG Filter: Minimum fair value gap size (%)
🔹 FVG Timeframe: Higher timeframe for multi-TF analysis
🔹 Visual Options: Toggle swing marks, FVG zones, labels
🔹 Alert Controls: Enable/disable LONG/SHORT notifications
═══════════════════════════════════════════════════════
📈 HOW IT WORKS:
1. The indicator scans for confirmed swing points using a robust double-confirmation algorithm
2. Simultaneously analyzes Fair Value Gaps on both current and higher timeframes
3. Validates market volatility to ensure sufficient price movement
4. Generates precise entry signals when all conditions align
5. Triggers customizable alerts for instant notification
═══════════════════════════════════════════════════════
🎯 BEST PRACTICES:
- Use on liquid markets (Forex majors, indices, crypto)
- Recommended timeframes: 15m, 1H, 4H
- Combine with support/resistance for confirmation
- Adjust lookback period based on market volatility
- Test alert settings before live trading
- Use JSON alerts for automated trading integration
═══════════════════════════════════════════════════════
⚡ ALERT CONFIGURATION:
1. Click the Alert icon (bell) in TradingView
2. Select "Liquidity Swap Detector Ultimate - TITAN v6"
3. Choose your preferred alert condition:
- LONG Signal: Only bullish setups
- SHORT Signal: Only bearish setups
- ANY Signal: All trading opportunities
4. Set expiration and notification preferences
5. For MT5 integration: Select "JSON" message type and configure webhook URL

SMC by ProfesorSMC by Profesor
Discover market structure mastery with SMC by Profesor – your ultimate Smart Money Concepts toolkit for TradingView. Identify bullish/bearish BOS & CHoCH breaks, plot internal/swing order blocks, detect EQH/EQL levels, highlight FVGs, and zone premium/discount areas. Visualize swing points, PDH/PDL lines, and trend-colored candles. Receive instant alerts for breakouts, gaps, and more. Perfect for ICT traders seeking precision in any timeframe. Historical or real-time mode – elevate your edge today!
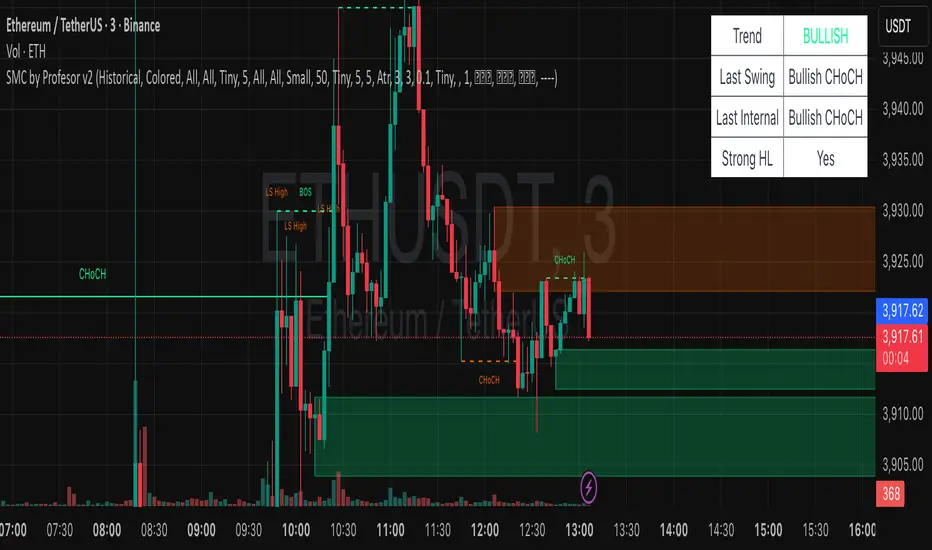
Dinkan Price Action Pro | Pure Price Action Toolkit🔸 Overview
Dinkan Price Action Pro is a pure price-action research toolkit that automatically detects and visualizes Order Blocks (OB), Fair Value Gaps (FVG), merged-candle hidden structures, liquidity zones (including HTF bias liquidity), and trendline & chart-pattern liquidity.
This indicator helps traders align with the Higher Time Frame (HTF) bias — the direction of the dominant institutional wave — and uncover hidden candlestick structures that normal timeframe charts never show.
⚙️ Core Features
✅ Automatic Order Block detection (bullish & bearish)
✅ Fair Value Gaps with real-time fill tracking
✅ Merged-Candle Engine — reveals hidden structures between standard timeframes
✅ Liquidity Zones — equal highs/lows, trendline liquidity & HTF liquidity pools
✅ HTF Bias Engine — detect directional bias across multiple timeframes
✅ Auto Trendlines & Chart Pattern Liquidity
🔍 How It Works (Step by Step)
🕯️ A. Merged Candle Engine (Hidden Structure)
1️⃣ Choose how many candles to merge (e.g., 3–5).
2️⃣ The script groups candles backward from the current bar in continuous sets.
3️⃣ Each merged candle forms using:
• Open = first candle’s open • Close = last candle’s close
• High = highest high • Low = lowest low
4️⃣ These new candles expose “hidden” structures between fixed timeframes — revealing true base-impulse patterns missed by normal charts.
🟩 B. Order Block Detection
Detects consolidation (base) followed by strong impulse.
Marks demand (green) and supply (red) zones automatically.
Strength calculated using impulse range (and volume, if available).
Older, mitigated OBs can be hidden for clarity.
🟦 C. Fair Value Gaps (FVG)
Automatically detects imbalances between consecutive candles.
Unfilled FVGs are highlighted; once filled, zones fade or gray out.
Works dynamically across merged and standard candles.
🟧 D. Liquidity Zones
Finds equal highs/lows, wick clusters, and structural liquidity.
Trendline liquidity and chart-pattern liquidity detected in real time.
Projects HTF liquidity zones from higher charts down to current timeframe.
🔺 E. HTF Bias Engine
Analyzes higher and medium timeframes (HTF/MTF) using CISD-style confirmation.
Bias auto-adjusts or can be manually selected.
🧭 Purpose: Identify the dominant institutional flow and trade in its direction.
⏰ Timeframe Alignment
Recommended structure:
HTF: 4H or 1D
MTF: 1H or 30M
LTF: 15M or 5M
Users may let the script auto-adjust or manually configure each timeframe combination.
📘 Inputs & Settings
🔹 OB sensitivity (Low / Medium / High)
🔹 Volume weighting toggle
🔹 HTF & MTF selection (Auto / Manual)
🔹 Multi-symbol mode
🔹 Visual toggles (OB, FVG, trendlines, merged candles, bias labels)
🔹 Alert toggles (zone touch, bias flip, hidden structure detection)
📊 How to Use — Workflow Example
1️⃣ Load the indicator on your chart.
2️⃣ Check the HTF Bias direction — trade only in that direction.
3️⃣ Identify nearby Order Blocks or FVGs inside HTF liquidity areas.
4️⃣ Watch the Merged Candle View to confirm hidden structures (base + impulse).
5️⃣ Wait for LTF confirmation (e.g., small structure break, wick rejection).
6️⃣ Place stop beyond the opposite OB edge; target next liquidity cluster.
🎯 This workflow aligns your lower-timeframe trades with the dominant higher-timeframe flow.
🧱 Repainting & Stability
Completed OBs and FVGs remain static — they do not repaint.
Real-time zones during candle formation can update until candle closes (standard behavior).
Merged candles are recalculated each bar; once a group closes, it remains fixed historically.
⚠️ Limitations
This is not a buy/sell signal generator.
Volume-weighted features require volume data.
Use responsible risk management and independent confirmation methods.
🔒 Invite-Only / Locked Code
The script is published as invite-only to protect proprietary implementations of:
The merged-candle engine
Liquidity and bias-detection heuristics
Invite-only publishing complies with TradingView rules.
All logic, purpose, and usage are fully described here for transparency.
🧩 Originality & Usefulness
This script is an original integrated system, not a simple mashup.
Each module is interconnected to provide a unified analytical process:
The Merged Candle Engine creates hybrid bars that expose hidden base–impulse patterns.
These merged bars feed into the Order Block and Fair Value Gap logic, refining zone accuracy.
The Liquidity Detector references those zones and merged bars to locate valid structural pools.
Finally, the HTF Bias Engine confirms directional context across multiple pairs and timeframes.
Together, these elements form a dynamic framework that interprets institutional footprints and structure flow — something no single indicator can achieve individually.
The combination produces new analytical value: a precise, adaptive HTF bias alignment and structure-based liquidity map in one visual system.
📜 Disclaimer
This tool is for educational and analytical use only.
It does not constitute financial advice.
Trading involves risk — always perform independent analysis and practice sound risk management.
Past performance does not guarantee future results.