Trading sessions, Ichimoku and Classic Pivots█ OVERVIEW
This a self contained intraday trading style for crypto/forex made to be on and traded on 15-min.
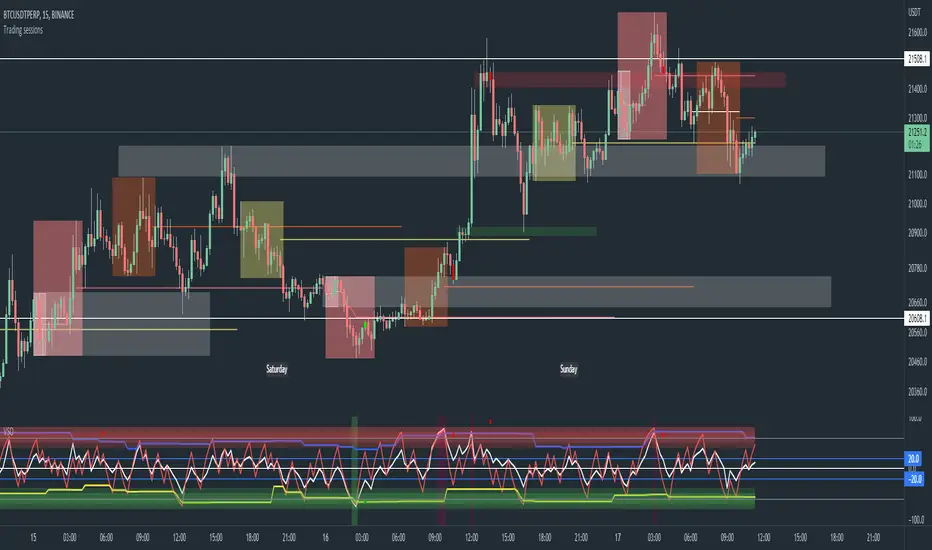
This Script Creates a box around each major session to a trading range, include highlights for the first 12 15-min candles, classic Pivot points and ichimoku cloud.
█ CONCEPTS
1 — Session boxes and ranges are based of the times from Steve from Beat the market maker, and you have the option in setting to have an extension for the high/low until the start of the next box calculation.
2 — 12 candle window, this marks the first 3 hours after a open;
The first hour - stop hunt
The second hour - big moves
The third hour - tend continuation or reversal
3 — The Days of the weeks are labelled and coloured;
Weekends are in grey, ideally no trade days.
Monday, Tuesday, Thursday are green, to mark the week days
Wednesday is red to be mindful of mid week reversal
Friday is red to mark the end of week
4 — Ichimoku cloud, by default the only thing visible is the kumo cloud, but in setting you can turn the line back on. Ichimoku proves a great mark for areas to look for support and resistances.
5 — Lastly, you have classic pivots, by default they are extend to the right and on weekly, Each level act as support and resistance. Look for Bullish momentum at R3 for a larger moves to the upside.
Ichimoku and the pivot are here mainly for when you want to do higher time frame analysis.
█ OTHER SECTIONS
• HOW TO USE
Example of a trade
**Key thing to remember is London will set the high in a down trend and the low in an up trend
you can see the first hour look for stops and stopped at 50% of the range set coming into the session, the second hour a big move to the down side hitting 200% expansion then the third hour reversal stopping wick up then
back down from from London low. before continuing down.
• LIMITATIONS: I have not test this on Stock, as I have a different strategies for those market
• NOTES : I know a lot of people have moving averages on their chart, I have another separate one with all MA types, and it something that will not fit into one script, Other things you can add with this Bollinger bands, and
fib tool with 50%, 100%, 150% and 200%
Session
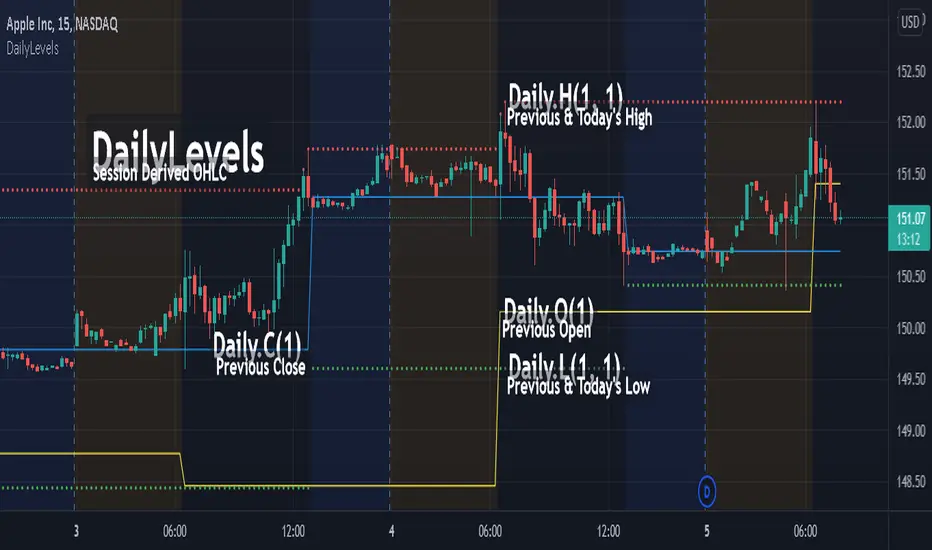
DailyLevelsLibrary "DailyLevels"
Functions for acquiring daily timeframe data by number of prior days.
openD(daysPrior, spec, res) Gets the open for the number of days prior.
Parameters:
daysPrior : Number of days back to get the open from.
spec : session.regular (default), session.extended or other time spec.
res : The resolution (default = '1440').
Returns: The open for the number of days prior.
highD(daysPrior, extraForward, spec, res) Gets the highest value for the number of days prior.
Parameters:
daysPrior : Number of days back to get the high from.
extraForward : Number of extra days forward to include.
spec : session.regular (default), session.extended or other time spec.
res : The resolution (default = '1440').
Returns: The high for the number of days prior.
lowD(daysPrior, extraForward, spec, res) Gets the lowest value for the number of days prior.
Parameters:
daysPrior : Number of days back to get the low from.
extraForward : Number of extra days forward to include.
spec : session.regular (default), session.extended or other time spec.
res : The resolution (default = '1440').
Returns: The low for the number of days prior.
closeD(daysPrior, spec, res) Gets the close for the number of days prior.
Parameters:
daysPrior : Number of days back to get the open from. 0 produces the current close
spec : session.regular (default), session.extended or other time spec.
res : The resolution (default = '1440').
Returns: The close for the number of days prior.
hlc3D(daysPrior, extraForward, spec, res) Gets the HLC3 value for the number of days prior.
Parameters:
daysPrior : Number of days back to get the HLC3 from.
extraForward : Number of extra days forward to include. Determines the closing value.
spec : session.regular (default), session.extended or other time spec.
res : The resolution (default = '1440').
Returns: The HLC3 for the number of days prior.
SessionInfoLibrary "SessionInfo"
Utility functions for session specific information like the bar index of the session.
inSession(spec) Returns true if the current bar is in the session specification.
Parameters:
spec : session.regular (default), session.extended or other time spec.
Returns: True if the current is in session; otherwise false.
minutesToLen(minutes, multiple) Converts the number of minutes to a length to be used with indicators.
Parameters:
minutes : The number of minutes.
multiple : The length multiplier.
Returns: math.ceil(minutes * multiple / timeframe.multiplier)
bar(spec, res) Returns the intraday bar index. May not always map directly to time as a bars can be skipped.
Parameters:
spec : session.regular (default), session.extended or other time spec.
res : The resolution (default = "1440").
Returns: The integer index of the bar of the session.
isFirstBar(spec, res) Returns true if the current bar is the first one of the session.
Parameters:
spec : session.regular (default), session.extended or other time spec.
res : The resolution (default = "1440").
Returns: True if the current bar is the first one of the session.
wasLastBar(spec, res) Returns Returns true if the previous bar was the last of the session.
Parameters:
spec : session.regular (default), session.extended or other time spec.
res : The resolution (default = "1440").
Returns: True if was the last bar of the session.

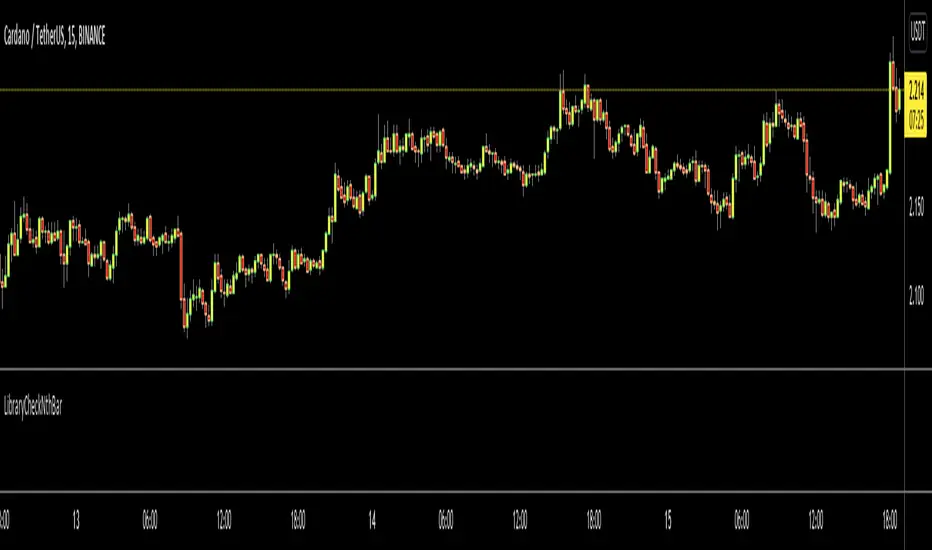
LibraryCheckNthBarLibrary "LibraryCheckNthBar"
TODO: add library description here
canwestart(UTC, prd) this function can be used if current bar is in last Nth bar
Parameters:
UTC : is UTC of the chart
prd : is the length of last Nth bar
Returns: true if the current bar is in N bar
Retail Bomber MK1Handydandy tool to wait for the whales to wake up and start trading.
Each Zone has a schedule (call it market session) and pumps and dumps can be seen on specific times.
And for each zone you can either Highlight the background of just the start time, the whole session, or color the bars instead of changing the background.
Each zone is already set for a specific market open (session open): ASIA, UK, SYDNEY, NY + other 2 extra zones.
All of this is customisable 🙂
To set the time configuration, it goes like this:
1230:1330:1234567
1230:1330 is the period of time you want to study
1234567 are the days of the week, where 1=Sunday...And you fall on 7=Saturday
Example: If we want to study the same ranges from Monday to Friday only, it goes like: 1230 1330:23456
Colors can be editable
Labels for each session can be changed too.
Still testing it.

[astropark] Kill ZonesDear Followers,
today I'm glad to present you an indicator which highlights for you the most important market Kill Zones .
This indicator will color background of the time sessions when Asia, London and New York sessions are going to be most active .
This way you can understand easier what istitutions and big hedge funds made during the session.
You can change colors and transparency in the indicator options, default colors are yellow for Asia, blue for London and red for New York sessions.
You can enable the indicator to show background also during the weekend (disabled by default).
This indicator works on all markets, I suggest not to use it above 1h timeframe, 5m-15m is great.
This is a premium indicator , so send me a private message in order to get access to this script.


Example - Custom Defined Dual-State SessionThis script example aims to cover the following:
defining custom timeframe / session windows
gather a price range from the custom period ( high/low values )
create a secondary "holding" period through which to display the data collected from the initial session
simple method to shift times to re-align to preferred timezone
Articles and further reading:
www.investopedia.com - trading session
Reason for Study:
Educational purposes only.
Before considering writing this example I had seen multiple similar questions
asking how to go about creating custom timeframes or sessions, so it seemed
this might be a good topic to attempt to create a relatively generic example.

Flexible timezone-aware session rangeAllows you to define session range with local time and its timezone, also can toggle session visibility any day of week.

Scalp Recorder█ OVERVIEW
When it comes to tracking your performance when scalping, you are either going to design an automatic algorithm or that you might just want to go with the flow record your performance on a spread sheet. We all know how boring and time consuming that as. I initially designed this easy and simple script for myself, because I wanted to focus on scalping and the chart I have at hand here on TradingView and not go to my spread sheet to enter every single scalp. But instead have something to enter after I am done with my scalping session.
This script is easy to use if you're a systematic trader where you'd have entries, exits and take profits already set.
Just enter your R value ( The amount you're risking per trade ), and manually add a trade to "# of trades" when you're done with a scalp and add the Rs from that scalp in the settings. A 2 seconds process to store that data and have it presented to you at all time on an elegant box at the corner of the screen! - you can also adjust the location of that box/table, and hide your profit and average profit per trade if you want to share your daily/scalping-session stats with a friend -
Enjoy!

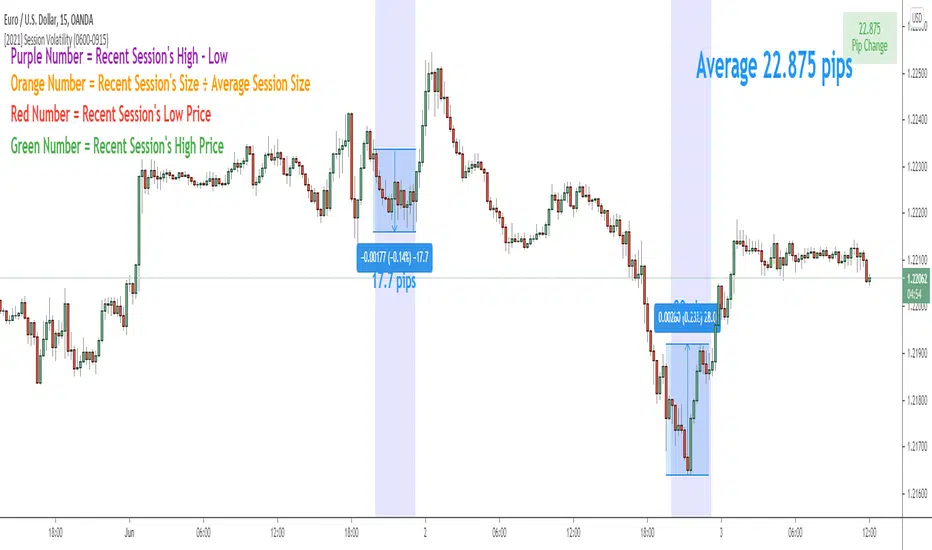
Session Volatility CalculatorHey traders!
This script calculates the average volatility of trading sessions.
You specify a start date, an end date, and a session time (eg. market open, Asian session etc)
The script then scans through all the price action on your chart and calculates the average price movement during that specified period.
What Is It For?
I created this script for my own purposes when developing certain strategies and testing certain ideas.
The purpose of this script is to give you an idea of how much price tends to move during certain times of day for certain markets.
You could think of it as a "session's average true range".
In crypto and forex this might be how much price tends to move on certain pairs during the Australian/Asian session, or the European session, or the overnight U.S. session etc.
In stocks this might be how much a symbol tends to move during the first hour of the day or the last hour of the day.
The point of calculating this information is for better understanding how markets move during certain times of day.
It's not a perfect science obviously since some days can be wilder than others depending on what fundamental events are developing, but it's useful information to have for times when there are no expected volatility-inducing events.
This info can help with optimizing targets and stop loss placement for certain day-trading strategies, and just generally getting an idea of what kinds of moves you might reasonably expect out of overnight positions or certain times of day etc - or at least that's what I use it for.
Settings
Hover your mouse over the "i" symbol to get more information on the script's settings, but here's a brief description:
Start Date: The date to begin calculating from (set to 1000 by default so it scans the entire chart).
End Date: The date to stop calculating (set to 2099 by default so it scans the entire chart)
Time Session: This is the time session during the day that you want to analyze.
Color Background: If turned on, this setting changes the background color to highlight the session.
Indicator Values
The indicator outputs a handful of values onto your chart. This is what the colors correspond to:
Top-Right Box: The average price range during the given time of day over historical price action.
Green Number: The recent session's highest price.
Red Number: The recent session's lowest price.
Purple Number: The recent session's price range (high - low).
Orange Number: The recent session's range ÷ the average (outputs a relative % of the average).
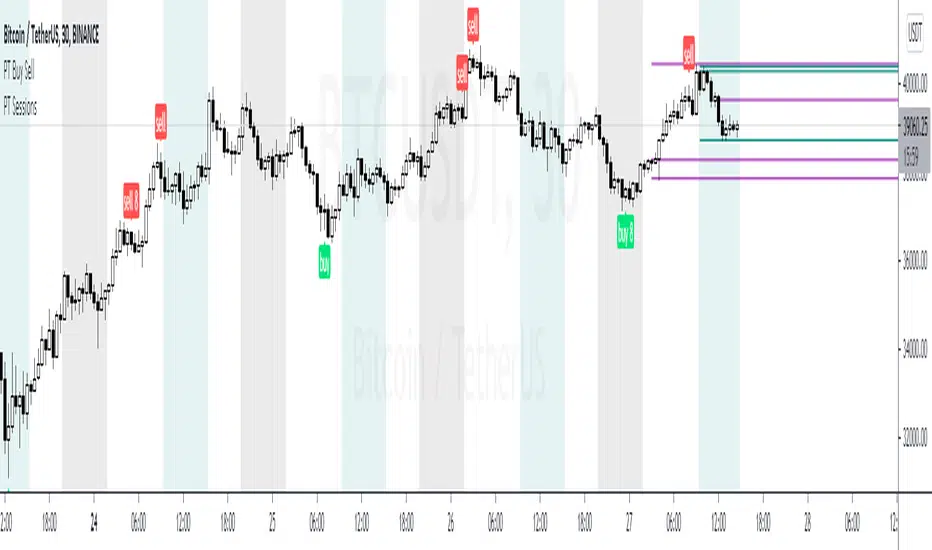
PT SessionsVersion 1.0 -
The sessions indicator helps you separate Asia, London & NY trading zones. We found it very useful to identify each session for scalping benefits.
The main strategy to this indicator is to scalp long/short at each sessions open/close where we suspect volatility to be at its peek. The high/low of each session is usually put in at the open/close of the zone. This helps set the tone for the upcoming sessions & more so for the full day. This indicator works well for FX and Crypto but was built specifically around crypto volatility times.
If you are interested in using our version of the PT Sessions , shoot us a message!
Day and Time HighlightYet another sweet little tool that highlights only specific days and time.
For example, you can highlight only Tuesday's and Friday's from 0930-1600
You can adjust to any day of the week and any time of the day.
You can request more improvements upon this version. Cheers!
Like if you Like and Follow me for upcoming indicators/strategies: www.tradingview.com

Trading SessionsSimple Indicator which shows 6 major trading sessions
in a label it shows what sessions are currently active or not
the background will color if you are in the session
The time can be easily adjusted in the settings as well as how the sessions are displayed

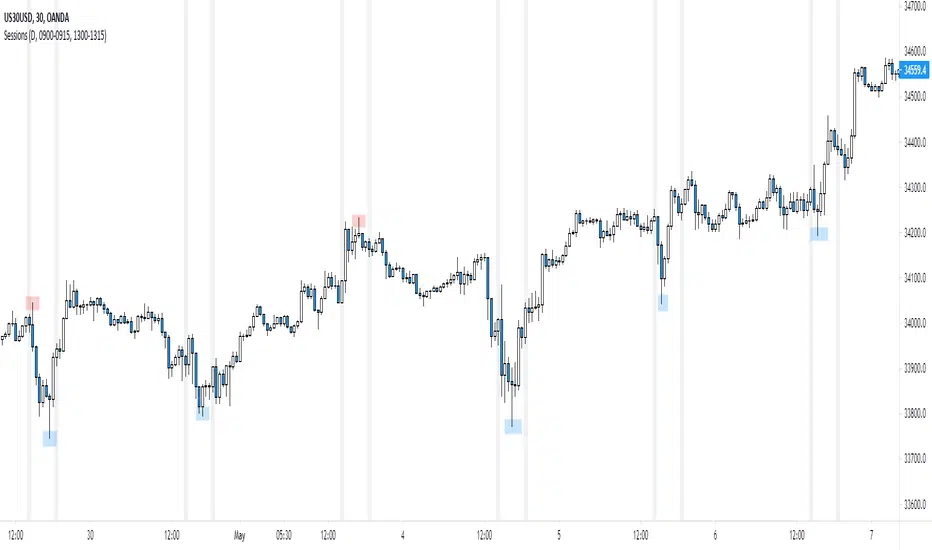
NY Session
Script to highlight the new york session trading hours
-The most volatile hours for us30 & the time in which it's most likely to make a significant high/low
[UTILS] Session Input ParserAn utility function to parse session inputs. Extracts hours, minutes and weekdays (if defined) and returns a tuple as the result.
_parseSession(sessionString) => (hourStart, minuteStart, hourEnd, minuteEnd, weekdaysArray)
Examples presented on the chart.

Session Breaks by KrisWatersThis indicator draw vertical lines on session break dates. There are 1H, 4H, D, W, M, 3M, 12M options. You can change line colors and style as you wish.
If you are using this indicator please drop me comment and like also.

MM Session Open AlgoThe MM Session Open Algo is a strategy to catch the opening breakout of a security
displays the current session with background color
Entry, Stop Loss Based on Atr, and two Take Profit levels
Kill zone entries for New york and London session
provides valid signal for entry once price crosses entry line
and set "opening session price" to determine what signal you are looking for. based on time frame
shows the Daily,Weekly,Monthly high and low
average daily range
and comes with trend filter.
Directions are Simple
when price crosses and closes above entry line. you get in with the set inputs of Tp and Sl
or you can set buy/sell stops with the price provided for you and ride the wave of the direction it goes with he Tp and Sl provided
Link below or PM us for access to this indicator Happy Trading

Reivaj MA - PreSession This script contains 9 moving averages which can be changed each between "sma", "ema", "wma", "vwma.
The values of the moving averages are:
MMA20 = SMA20
MMA50 = SMA50
MMA100 = SMA100
MMA200 = SMA200
MMA300 = SMA300.
MMAextra1 = ema 8
MMAextra2 = ema21
MMAextra3 = sma400
MMAextra4 = sma500.
It has an Asian range that goes from 21: 00-07: 00 UTC which turns the color of the candle in green.
And pre-sessions that is one hour before the opening, the time of the opening and the hour after the opening of London and New York.

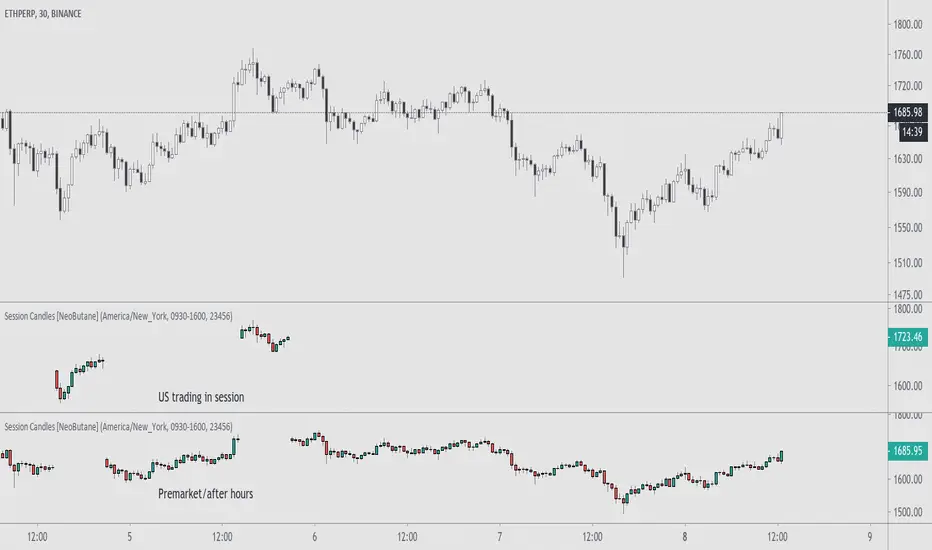
Trading Session Candles [NeoButane]█ OVERVIEW
Display candlesticks for the selected session, regular or extended.
█ CONFIGURATION
Options to change include displaying the regular or extended session, timezone, session hours, and session days.
█ CONCEPTS
Meant for charts with longer trading sessions or to view only extended hours trading action on US stocks that have afterhours available.
█ Notes
For trading days, '23456' refers to Monday to Friday.
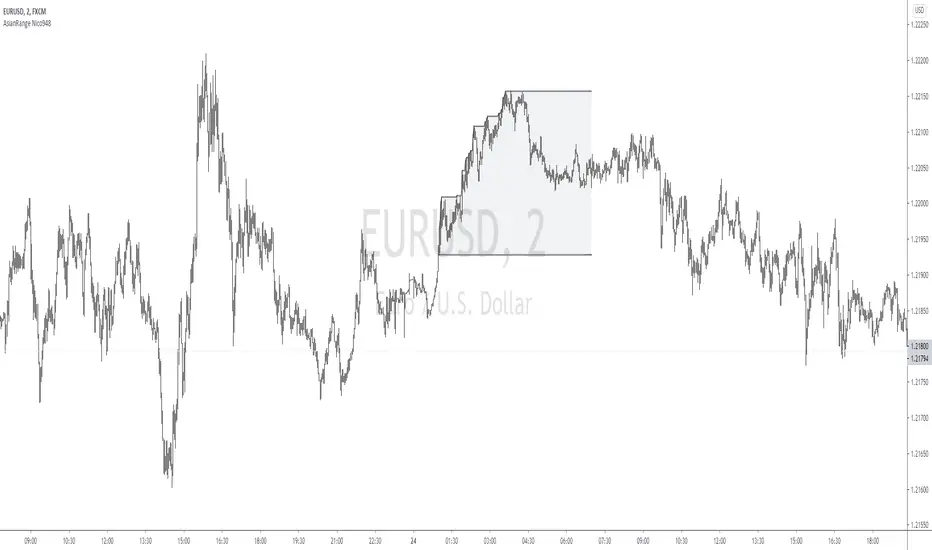
Asian Range by Nico948Displays the Asian session range on your graph.
Masked for timeframes higher than 15 minutes.
However, it can be displayed on 1 hour timeframe by filling in the relevant box in the parameters.
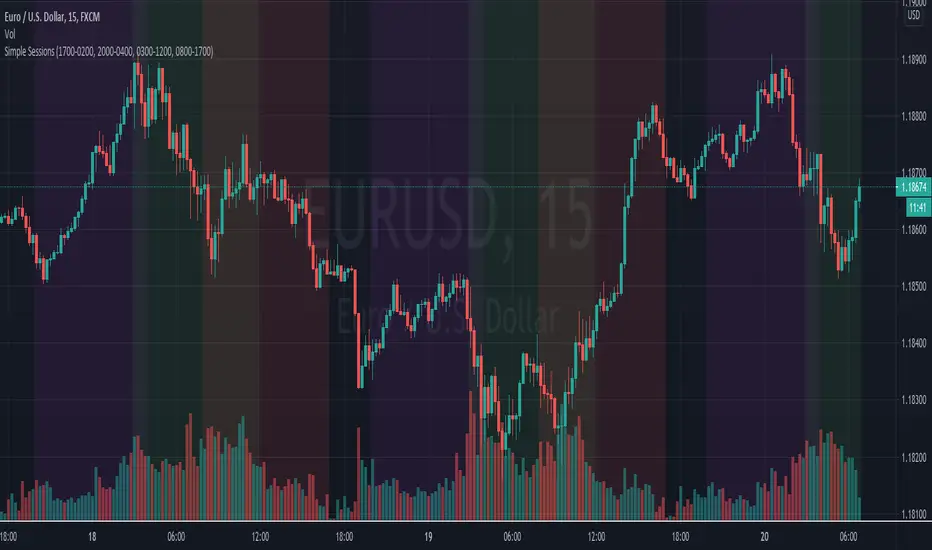
Simple Sessions## Background ##
Simple Sessions is based on the very awesome "Sessions on Chart" by Aurocks_AIF.
I really liked how the background colours worked but wanted to simplify it by removing some parts that I didn't use. I then simplified much of the code, put it into my standard template format and re-published. Hopefully the code is a bit cleaner and easier to read now.
## Usage ##
The default indicator shows the following sessions:
* Sydney in Navy
* Tokyo in Purple
* London in Green
* New York in Red
The good news is that using Green and Red for London and New York, gives a nice distinct yellow for the overlapping sessions. Sydney and Tokyo are by in similar colors by design.
By default, only London and New York show, but you may turn on Sydney and Tokyo in the settings.
## Use, Share, Like, etc #
Have fun!
-- chilts
Session Range and Breakout Summary
This script presents the session range and post session movements relative to that range of all the majors and crosses on a single page. You can also set it to a daily range and weekly range (beta). It will even show you the pip value of the range. I made the indicator to easily stay on top of market movements at london open relative to the Asia session range. Its very easy to see which entire currency group is breaking its asia range WHIST ITS HAPPENING. Focus on NZD in the examples as it was the market lead today - I was able to get some of it when I saw the entire group breaking its range
Showing all the majors and crosses relative to the Asia range (00:00 - 07:00 GMT)
Active 'show on chart' to verify the indicator is measuring the range correctly. Compare below to the NZD box above - you can see how NZD had control of the market this morning and all NZD pairs broke out of their ranges.
'PIP MODE' - active pip mode to see what the pip range was of the session
Notes
The information is presented RELATIVELY - this means that all the ranges and movements are scaled to be the same size. You are therefore seeing the movements relative to their ranges. When you see a breakout it relative to the size of the range - for example, if GBPJPY had a range of 50pips and breaks out of the range by 100 pip and GBPEUR has a range of 20 pips and breaks out by 40 pips they have both broken out double the range and will be displayed as the same distance.
The indicator will show the movements whilst the range is forming. I did this so I can see what the groups are doing before Europe open and be ready - such as lingering at the top end of its INCOMPLETE asia range. Be aware through that if the lines are flat at the top of the range WHILST THE RANGE IS STILL FORMING this does not mean price was flat, it means that price was pushing up and growing the range. (Price can't breakout until the range has formed at the end of the session)
The currency pairs are organised to show the strength or weakness of the selected group - this means that the base currency is always the select group. This is to present the data with currencies moving in the same direction rather than some reversed but meaning the same in relation to currency strength. In the NZD example:
NZDAUD (not AUDNZD )
NZDCAD
NZDCHF
NZDEUR (not EURNZD )
NZDGBP (not GBPNZD )
NZDJPY
NZDUSD
I hope its useful. This is the most powerful indicator I've managed to write yet. It was difficult to make the code efficient enough to fit into the pinescript limit and still do everything.
